Cross-posted from Martin North’s DFA blog:
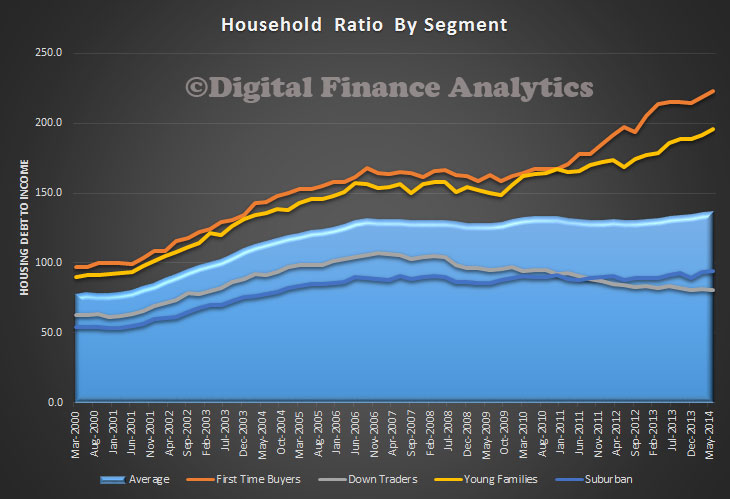
Yesterday DFA posted the most recent RBA household ratios showing that overall debt for households is higher than its ever been. Today we take the argument further, with detailed analysis across our segmentation, looking at loan to income ratios. TheDFA segmentation positions households on a multi-factorial basis, including demographics, wealth and life-stage. The data here is the average across Australia by segment, there are significant state variations, which we won’t cover today. We see that the average is around 137. However, first time buyers have a more adverse ratio well above 200, and young families, just below 200. On the other hand, suburban families have a ratio around 100, and down traders are even lower. So my point is (once again) that averages can hide a world of differences. It is also worth noting that different household segments tend to live in different suburbs, so the net economic impact on an area will be different. One final point, the incomes are current ones (to take account of falling incomes in real terms) for our segments.