For no apparent reason, US shares are pouring it on once more. Perhaps it’s a little relaxation about the Ukraine, perhaps it’s greater comfort with the rebound in US activity, perhaps it is the prospect of European QE or it’s the relative void of news.
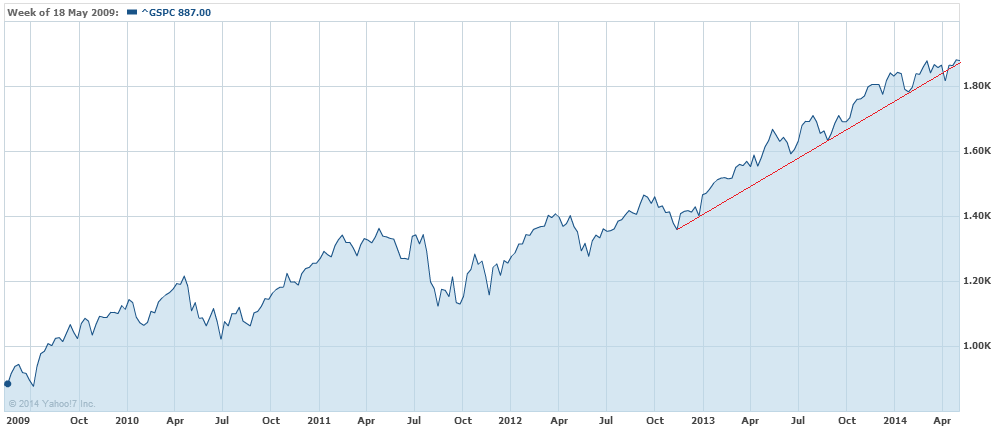
Whatever it is it was a powerful evening in stocks, piling on 1% and breaking to a record high just shy of 1900:
Despite the new high, the strong up trend in place since the resolution of the European crisis in late 2012 has broken and consolidation has been underway since the reduction of QE began.
Advertisement
STA Wealth Management takes a look today at whether or not the new phase is consolidation or rollover:
The first chart shows the percentage change in the number of stocks on bullish “buy”signals for the S&P 500 in 2011, 2013 and currently.
In 2011, the change in the number of stocks on “bullish buy signals” was deteriorating sharply and by mid-May was down 15%. This was as opposed to the consolidation process in 2013 as the change in the number of stocks rose by 20%. Notice, that during the current correction process the number of stocks on bullish buy signals has fallen by 15% at the same point as we were in 2011.
The next chart is the percentage change in the CBOE Total Put/Call Ratio. Like the VIX, the put/call ratio is a gauge of investor’s “fear” of a correction in the financial markets. When investors are complacent, or lack fear, markets tend to rise. However, when this index is on the rise it is generally a sign that underpinnings of the market are more fragile.
In 2013, the markets consolidated and there was virtually no “fear” of a correction. In fact, the longer the consolidation process continued, the less fearful investors became. This was not the case prior to the onset of the correction in 2011, nor is it today.
Lastly, the NYSE High-Low Index, which measures the number of stocks hitting new highs versus new lows, is an indicator of the participation of stocks in the market. Again, I am looking at the percentage change in the number of stocks hitting highs versus lows.
In both 2011, and currently, the percentage change in the number of stocks hitting highs versus lows was virtually unchanged. This is as opposed to 2013 when new highs were accelerating over new lows as the percentage change in the index rose to nearly 90%.
Adding to internals not being as favourble as they might be is the cycling from high-beta stocks to defensives which is the same late-cycle process that transpired during the market blowoffs in 1999 and 2008.
Advertisement
I’ve backed this rally since early 2013 and remain constructive on the US economy this year so its stock market should receive support from that quarter. And then there’s the old Jesse Livermore platitude that during a bull market one should be bullish, especially so when one is backed by the Yellen put.
My guess is there’s another up leg in it, ultimately derailed by the Chinese reckoning.
David Llewellyn-Smith is Chief Strategist at the MB Fund and MB Super. David is the founding publisher and editor of MacroBusiness and was the founding publisher and global economy editor of The Diplomat, the Asia Pacific’s leading geo-politics and economics portal.
He is also a former gold trader and economic commentator at The Sydney Morning Herald, The Age, the ABC and Business Spectator. He is the co-author of The Great Crash of 2008 with Ross Garnaut and was the editor of the second Garnaut Climate Change Review.