
Last night’s market action saw a decent bounce in stocks with the S&P up 12 points. However, the more important action was in bond markets which, despite the rise in stocks, remained strongly bid and again threatened to break yields down to new lows.
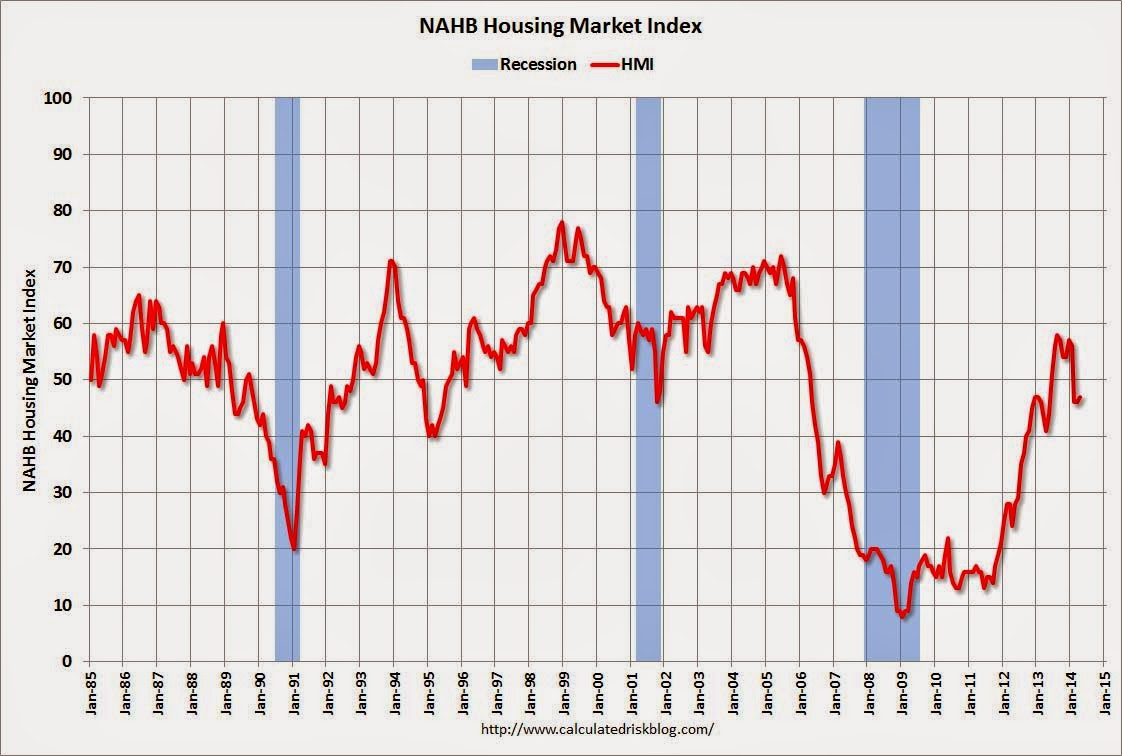
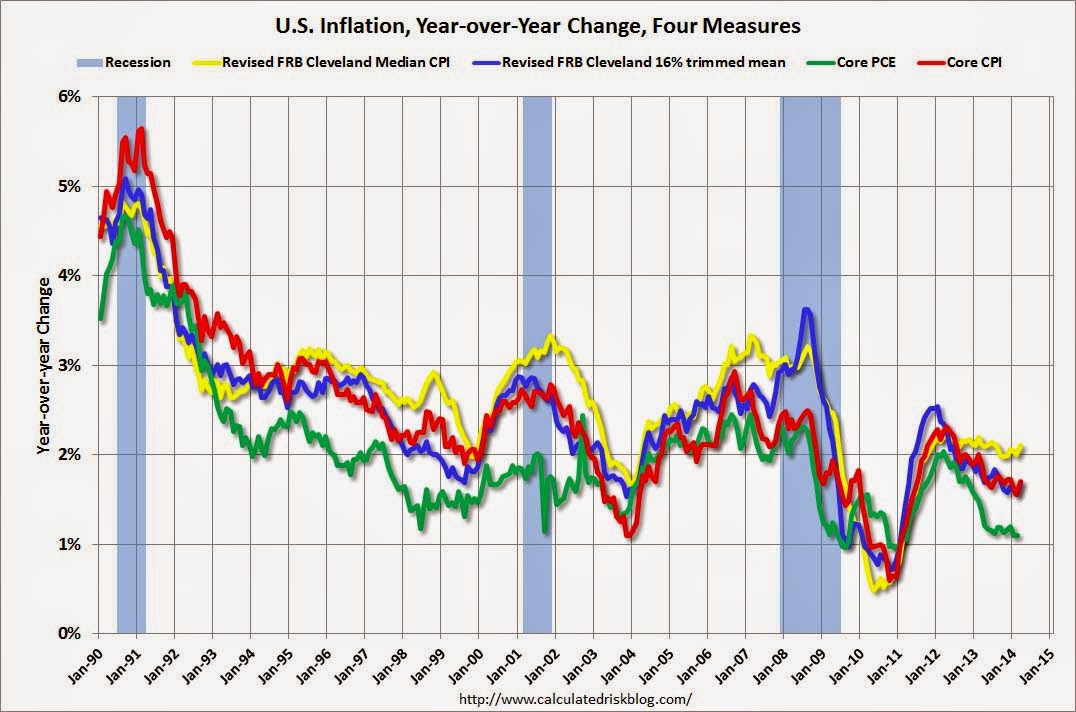
Data for the night was modestly positive. The NAHB Builder Confidence Index rose slightly to 47, the Empire State manufacturing index fell slightly to 1.5 points and inflation data rose slightly (all charts from Calculated Risk):
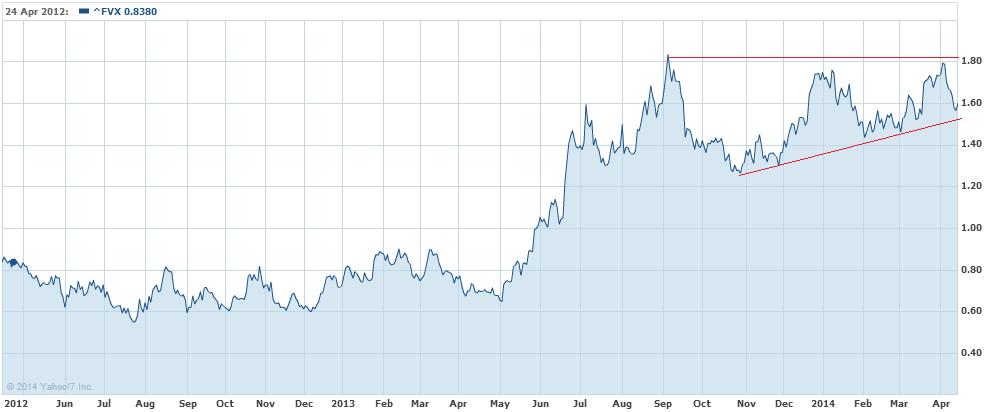
The upshot for bonds was that at the short end yields rose 1% on the two and five year and both have bearish charts with ascending triangles in place. Here’s the five year:
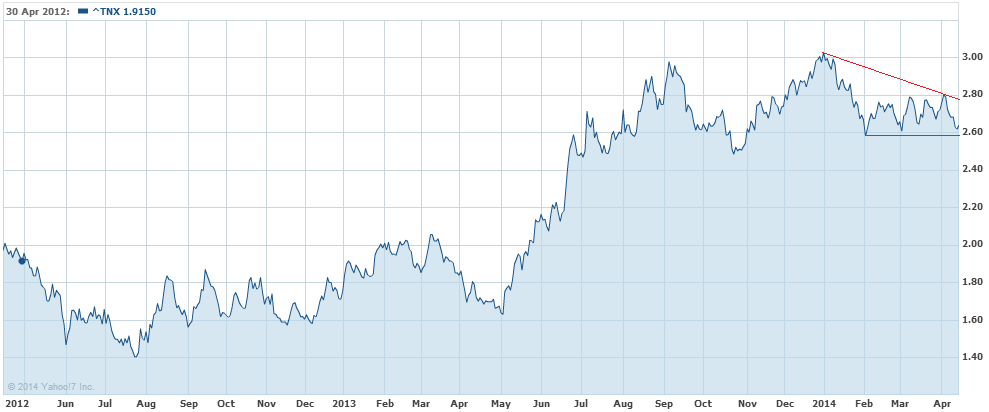
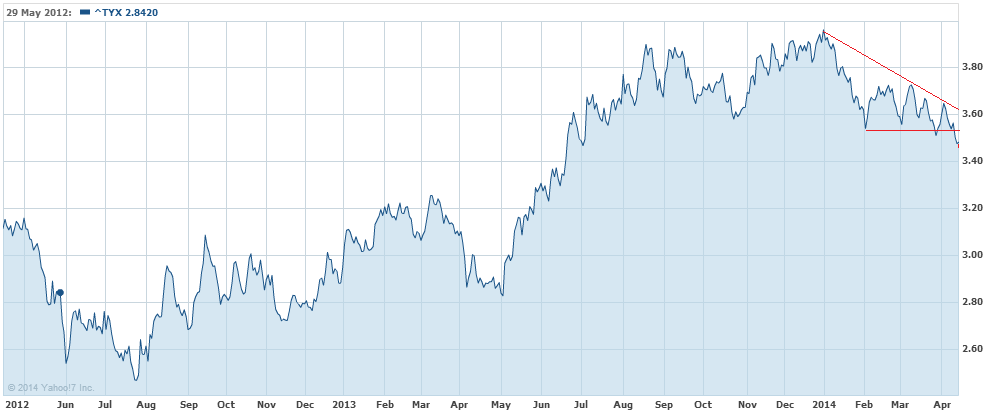
But the 10 and 30 year have precisely the opposite with descending triangle charts and strong bids even as stocks bounced. The 10 year hit 2.6% support before rebounding to 2.63%:
And the 30 year closed at a new low at 3.46% after its recent breakdown:
This flattening curve is typically seen as bearish and, if it continues at length, likely will be. But there is still a good argument that it bodes well for Goldilocks growth as the cash rate moves away from zero, inflation remains benign and interest rates contained, promoting growth.
For broader markets it means ongoing downwards pressure on stocks and the US dollar, the opposite for the Aussie, and some support for gold.
