From Credit Suisse via Zero Hedge comes a technical argument for a top in stocks:
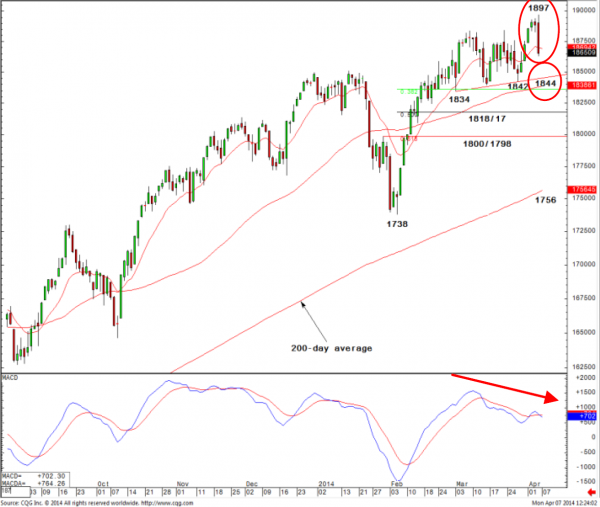
Indeed, not only has the market all but achieved our 1900/10 target (Friday’s high was 1897), but thesubsequent rejection from there has seen a bearish “reversal day” complete on increased volume.Below 1863 is needed to keep the immediate risk lower for a test of key price support at 1844/34 – the March lows, rising 63-day average and 38.2% retracement of the February/April rally and “neckline” support. Despite all our fears of a top, only a move below here would see a bearish reversal confirmed. If achieved though, we would look for a decline to 1800/1798 initially, and potentially as far as the mediumterm uptrend and rising 40-week average, currently seen at 1778/68.
While 1844/34 holds, no top will complete, keeping the trend higher.
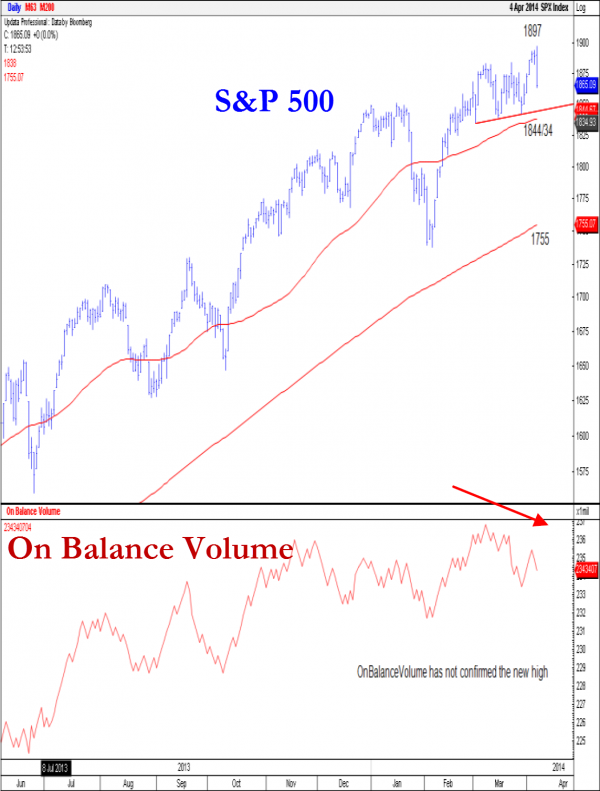
Volume did not confirm the new high
Whilst market breadth has been trending and continues to trend higher, the volume picture has also shown signs of deterioration over the past few weeks after having previously been steadfast. Not only did Friday see increased volume for the “reversal day”, but cumulative OnBalanceVolume (our favourite volume measure) has been trending lower since early March, and more importantly shows a bearish divergence, again warning of a weakening bull trend.
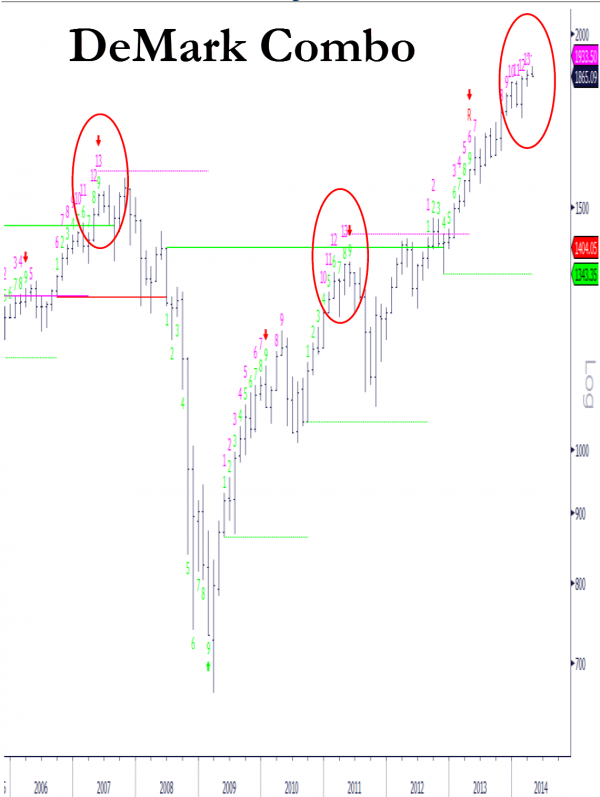
Exhaustion signals have been present for a while
In addition, as we have highlighted on several occasions, the more aggressive DeMark Combo indicator holds daily, weekly and monthly “13” sell signals. The more widely used sequential indicator also holds a weekly “13” sell signal, although it should be noted, not daily or monthly signals.
With Defensives also starting to show signs of further improvement relative to Cyclicals, and Large Caps completing a base relative to Small Caps, we remain of the view that at the very least a potentially important rotation trade is underway and more realistically a top may be close to constructing.
In summary, our 1900/10 core bull target has been all but achieved, but we need to see a break below 1844/34 to see a top established.
Typically one needs a broader turn for the worse to drive a decent stock market correction as concerns about future earnings are discounted (unless stock valuations are themselves the imbalance). With the global economy going OK, the US emerging from a winter slump, China supported by short term stimulus (real and imagined) and Europe it’s usual low level basket case, any S&P correction will be driven by a combination of correcting tech valuations and the risk that the Ukraine descends into civil war, threatening a global energy shock.
The odds of disruption are growing but we should note as well the unearthly calm that has descended upon forex markets!
David Llewellyn-Smith is Chief Strategist at the MB Fund and MB Super. David is the founding publisher and editor of MacroBusiness and was the founding publisher and global economy editor of The Diplomat, the Asia Pacific’s leading geo-politics and economics portal.
He is also a former gold trader and economic commentator at The Sydney Morning Herald, The Age, the ABC and Business Spectator. He is the co-author of The Great Crash of 2008 with Ross Garnaut and was the editor of the second Garnaut Climate Change Review.