

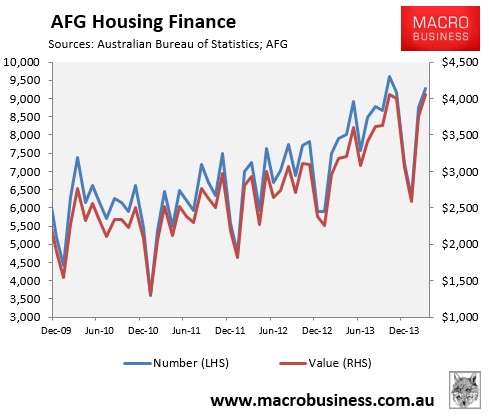
As summarised by Houses & Holes yesterday, Australian Finance Group (AFG) yesterday released its housing finance data for the month of March, which registered an 6% increase in mortgage applications over the month, but more importantly (since the series isn’t seasonally-adjusted) a 17% increase in the number of applications over the year. It was also the Group’s strongest March on record, with 9,264 mortgage applications (valued at $4,045 million) processed over the month (see next chart).
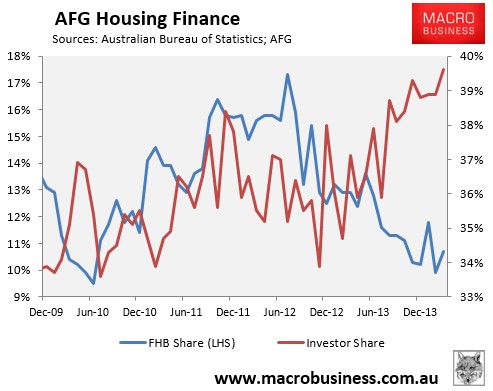
AFG also reported a slight increase in first home buyer (FHB) mortgage share in March – from 9.9% to 10.7%. Here’s how FHB mortgage demand has changed over the year:
- National: 10.7%, down from 12.9% in March 2013;
- New South Wales: 3.4%, down from 4.0% in March 2013;
- Victoria: 12.2%, down from 18.3% in March 2013;
- Queensland: 5.1%, unchanged from March 2013;
- Western Australia: 22.4%, down from 22.9% in March 2013; and
- South Australia: 17.3%, up from 15.3% in March 2013.
However, investors are still driving new mortgage demand, with their share of mortgages hitting a record 39.6% in March, according to AFG (see next chart).
Below are the investor shares by major market, with a big jump in Queensland driving the monthly result, but New South Wales maintaining its status as the Mecca of property speculation, with almost one in every two AFG mortgage applications going to investors:
- National: 39.6%, up from 37.1% in March 2013;
- New South Wales: 49.0%, up from 47.4% in March 2013;
- Victoria: 36.5%, up from 34.8% in March 2013;
- Queensland: 37.1%, up from 34.5% in March 2013;
- Western Australia: 32.0%, up from 28.6% in March 2013; and
- South Australia: 32.4%, down from 34.3% in February 2013.
As noted previously, some caution should be exercised in interpreting AFG’s figures and extrapolating its results to the overall mortgage market, as measured by the Australian Bureau of Statistics (ABS).
AFG’s data measures mortgage applications, whereas the ABS measures actual mortgage commitments. According to AFG’s General Manager of Sales & Operations, Mark Hewitt, just over three quarters of applications on average become mortgage commitments, although this figure can obviously fluctuate month-to-month. AFG’s market share has also been rising in recent years.
Therefore, while AFG is a useful guide as to the strength of mortgage demand, its results do not necessarily translate to the overall mortgage market as captured later by the ABS.
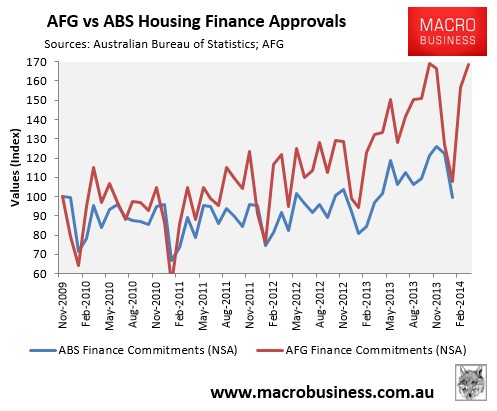
To illustrate, consider the below chart showing how the growth of AFG mortgage applications has diverged significantly from ABS mortgage commitments since November 2009:
Nevertheless, the AFG data supports recent ABS housing finance releases showing an increasing share of investors in the mortgage market.
unconventionaleconomist@hotmail.com
