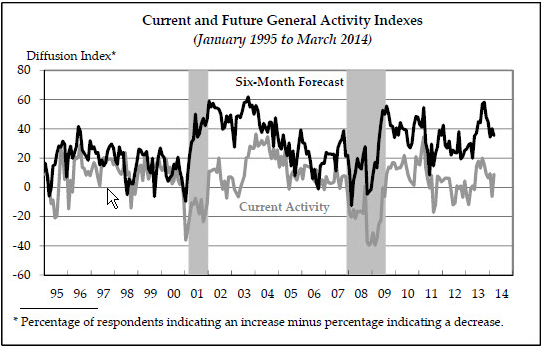
The S&P rallied 11 points last night as we saw the first real sign of Spring thaw in US data. The Empire State manufacturing index bounced in March:
The survey’s broadest measure of manufacturing conditions, the diffusion index ofcurrent activity, increased from a reading of ‐6.3 in February to 9.0 this month, nearing its reading in January (see Chart). The current shipments and new orders indexes also returned to positive readings this month. The demand for manufactured goods, as measured by the current new orders index, in‐ creased from ‐5.2 to 5.7 this month. Shipments also increased, with its index rising 16 points to a reading of 5.7. Firms reported, on balance, shorter delivery times and an increase in unfilled orders this month. Low‐ er inventories were also reported in March.
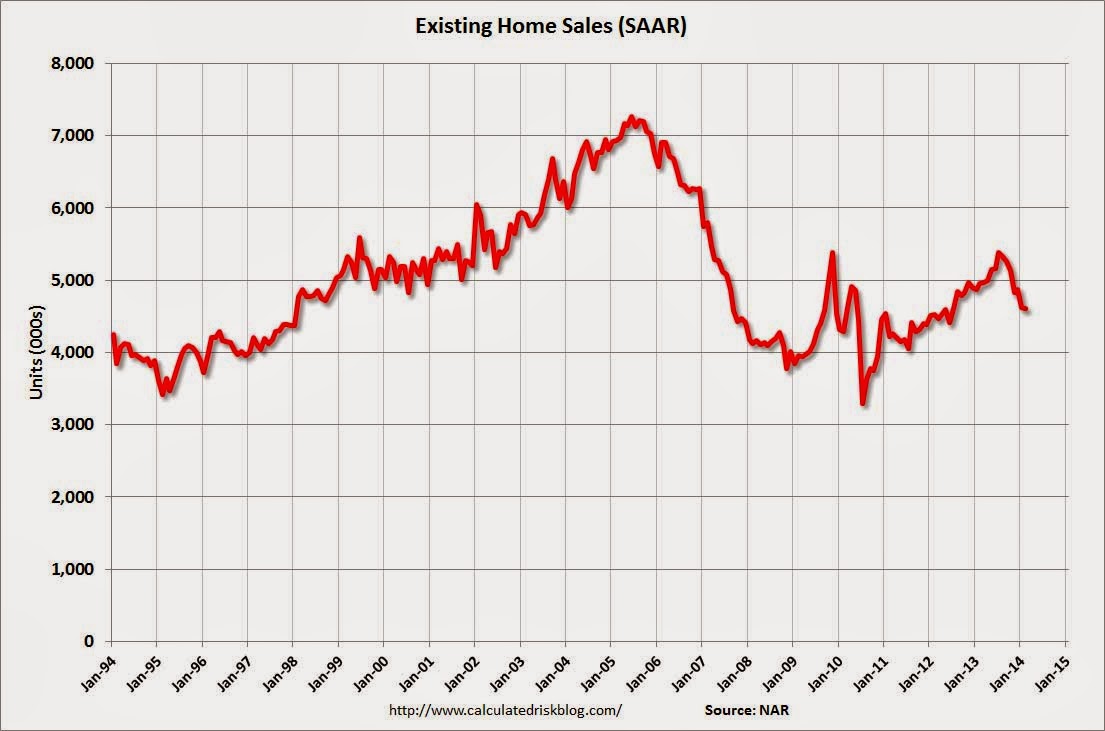
Other data was not so good but markets didn’t care. Weekly unemployment claims were 320,000, an increase of 5,000 from the previous week’s unrevised figure of 315,000. The NAR existing home sales data was weak again (chart from Calculated Risk):
Total existing-home sales, which are completed transactions that include single-family homes, townhomes, condominiums and co-ops, declined 0.4 percent to a seasonally adjusted annual rate of 4.60 million in February from 4.62 million in January, and 7.1 percent below the 4.95 million-unit level in February 2013. February’s pace of sales was the lowest since July 2012, when it stood at 4.59 million.
…Total housing inventory at the end of February rose 6.4 percent to 2.00 million existing homes available for sale, which represents a 5.2-month supply at the current sales pace, up from 4.9 months in January. Unsold inventory is 5.3 percent above a year ago, when there was a 4.6-month supply.
Advertisement
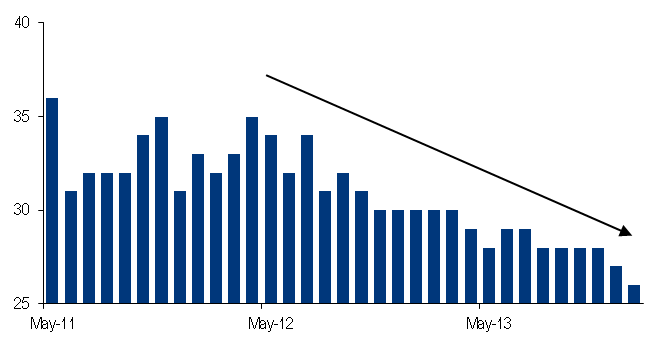
Inventories are still low, though, so prices may roll for a while yet, even if, like here, first home buyers are increasingly absent, from BofAML:
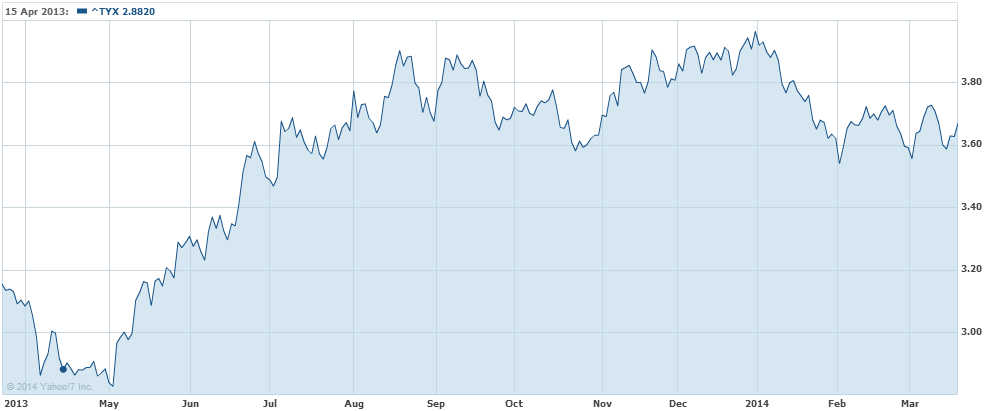
As said, stocks were happy, but bonds not so much. They retained yesterday’s losses but still aren’t in any hurry to sell. The 10 year and 30 year yields were flat and the charts still look bearish to me:
Advertisement
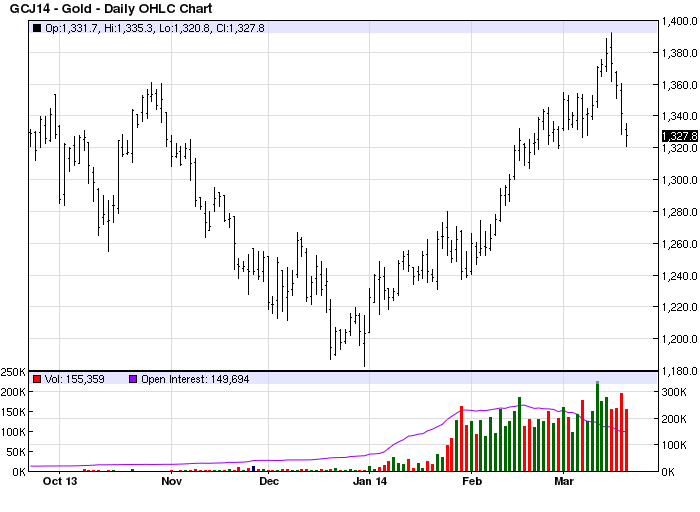
Wider markets were also mixed. Gold was hammered another 1%:
Advertisement
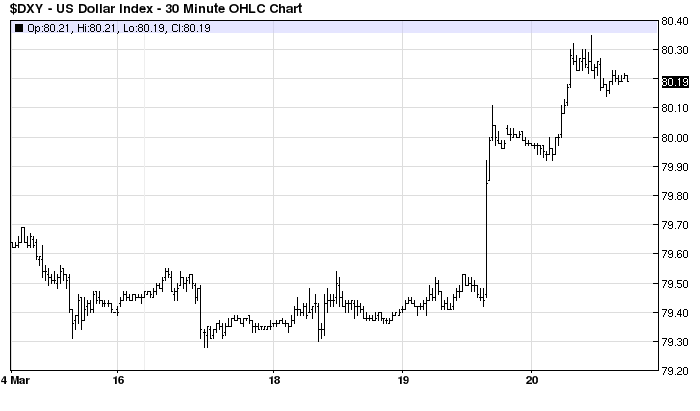
The US dollar was up again but is still in a large sideways band:
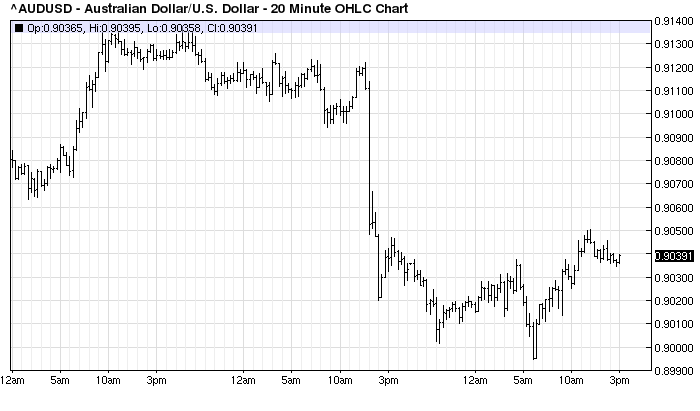
And the Australian dollar managed to hold 90 cents:
Advertisement
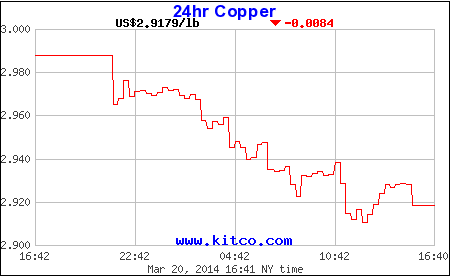
This is despite the issues swirling around China, which took copper down to a flirt with new lows:
It’s long term chart is till ugly.
Advertisement
All in all, a mixed night with no terribly persuasive market action either way.
David Llewellyn-Smith is Chief Strategist at the MB Fund and MB Super. David is the founding publisher and editor of MacroBusiness and was the founding publisher and global economy editor of The Diplomat, the Asia Pacific's leading geo-politics and economics portal.
He is also a former gold trader and economic commentator at The Sydney Morning Herald, The Age, the ABC and Business Spectator. He is the co-author of The Great Crash of 2008 with Ross Garnaut and was the editor of the second Garnaut Climate Change Review.