In March 2010, just before Australian house prices peaked, the Sunday Telegraph published an article citing CommSec research showing the sharp deterioration of housing affordability over the past 50 years:
AUSTRALIANS have to work almost three times harder to pay off the average family home than they did 50 years ago.
Figures compiled by CommSec for The Sunday Telegraph reveal homebuyers on the average income now have to work for 19,374 hours to buy the average Australian house with the average mortgage.
Based on an eight-hour day and a five-day working week, that equates to about 10 years of work. In reality, it takes much longer to own a home, because wages must pay for all living expenses, not just housing.
In 1960, it took homebuyers just 7500 hours to pay off the average mortgage.
CommSec chief economist Craig James said that half a century ago, average wage-earners took home the equivalent of $1.08 an hour.
They needed to work 25 hours to meet the monthly mortgage repayment of $25, based on an average five per cent interest rate and a mortgage of $4620.
Today, the average worker earning $30.04 an hour spends 70.7 hours – or almost two weeks of the month – at work to cover the monthly mortgage repayment for an average $283,000 loan at a 6.64 per cent interest rate.
The figures show rising costs and growing property prices have largely outstripped wages and young couples today need to work longer and harder to achieve the great Australian dream of owning their homes.
Whereas homes were once affordable on a single wage, families now realistically need two incomes to fund a mortgage.
Yesterday evening, CommSec back flipped on its previous research, releasing a new report claiming that Australia’s Gen-Y’s have little to complain about, since housing is just as affordable as a decade ago:
Advertisement
Gen Y has no reason to blame parents or grandparents – home affordability hasn’t really budged in the past decade. Home prices may be up, but so are disposable incomes.
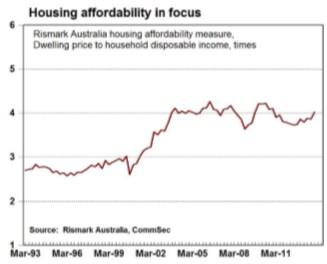
Now when you are measuring home prices, you want the best information available. And that is the data from the RP Data/Rismark Home Value index. And if you want to measure income, there is no better source that the Australian Bureau of Statistics. Put the two together and you should have the most accurate measure of home affordability.
The latest figures for the December quarter reveal that the median price of a home, in data taken from all regions across Australia, was $450,000. The ABS national accounts estimate of disposable income was $1007.5 billion. The estimate of the number of households across Australia (from the Housing Industry of Australia) was 9,002,348. And the estimate of disposable income per household was $111,919. Put the data together and Rismark calculates that the median home price was around 4.0 times disposable income in the December quarter.
That result for housing affordability was up from 3.9 times income in the September quarter 2013 and recent low of 3.7 times income in June quarter 2012 – the latter result being equal to the best result in three years and just above the best (most affordable) result in a decade.
CommSec’s claim that it has used the most accurate measure of housing affordability is bogus. CommSec’s measure of disposable income is an average taken from the quarterly national accounts, which includes a whole bunch of non-disposable measures like compulsory superannuation contributions, as well as owner-occupied imputed rents, neither of which are available to fund current consumption. Accordingly, average incomes have been inflated.
Moreover, CommSec has compared the median dwelling price against average disposable incomes – the wrong approach since average incomes are skewed upwards by the small proportion of very high income earners. Again, this has the effect of skewing the ratio downwards.
Advertisement
The end result is that the 4-times incomes figure is severely understated; although to its credit, it does provide a reasonably accurate depiction of trend changes in affordability over time.
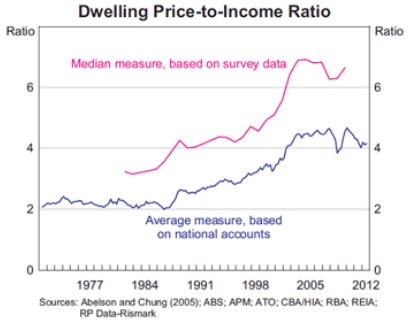
Using proper data on median household disposable incomes, taken from biannual ABS household surveys, would give a dwelling price-to-income ratio of more than 6 times currently (see next chart).
Advertisement
Back to CommSec:
Over the past year the median home price rose by 5.9 per cent, outpacing the 1.7 per cent lift in income per household. But interestingly over the past decade, the average income per household has risen by 70.6 per cent, outpacing a 66.7 per cent lift in home prices.
What does it mean? Simply, Australians have got richer over time. And, in fact, over the past decade, incomes have grown slightly faster than home prices. But broadly over the decade little has changed in terms of home affordability – it has gone sideways.
Certainly homes are less affordable than 20 years ago, but that is not because income growth has been sluggish, but because wealthier Australians, utilising lower interest rates, and benefitting from more affordable basic necessities like food, clothing and transport, have channelled extra dollars into the family home. Homes are bigger and of higher quality than 20 years ago.
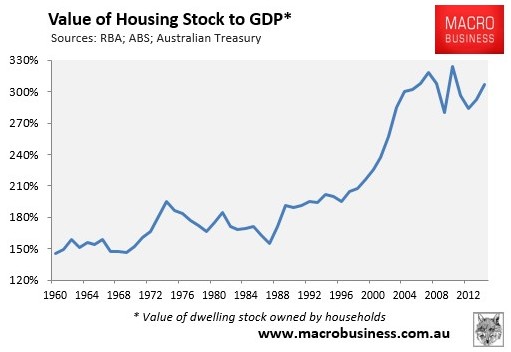
Sure, housing is just as unaffordable as a decade ago. But what if we take a longer view, as CommSec did in its 2010 research (above). Then you find that Australian housing is expensive relative to long-run norms, whether measured against national output (GDP):
Advertisement
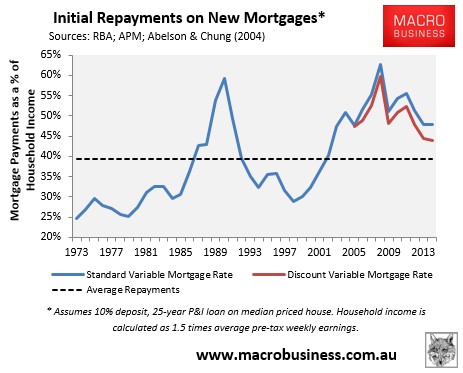
Or when taking Australia’s record low interest rates into account:
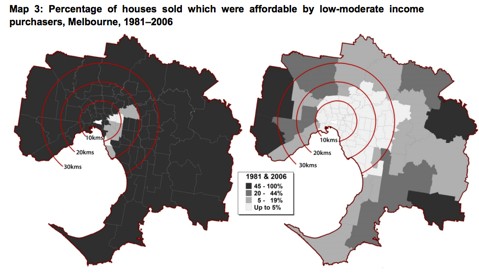
Or when examining the proportion of homes accessible to lower income earners. For example, according to an AHURI investigation, the percentage of affordable dwellings available for low-to-moderate income purchasers worsened materially in Melbourne between the years of 1981 and 2006, as illustrated below (the darker areas are the ‘most’ affordable, whilst the white patches are the least).
Advertisement
Further, as explained in detail in my latest MB Member’s report, Australia’s economy is on a wildly different trajectory than was the case a decade ago, with the economy facing multiple challenges.
A decade ago, Australia’s economy was about to embark on the biggest commodity price and mining investment boom in the nation’s history – a boom that would significantly boost Australian incomes and employment. Now we are coming out the back of that boom, with the economy facing rising unemployment, anaemic income growth, as well as falling labour force participation and rising old aged dependency.
Advertisement
Finally, CommSec’s claim that “homes are bigger and of higher quality than 20 years ago” does not stand-up to scrutiny.
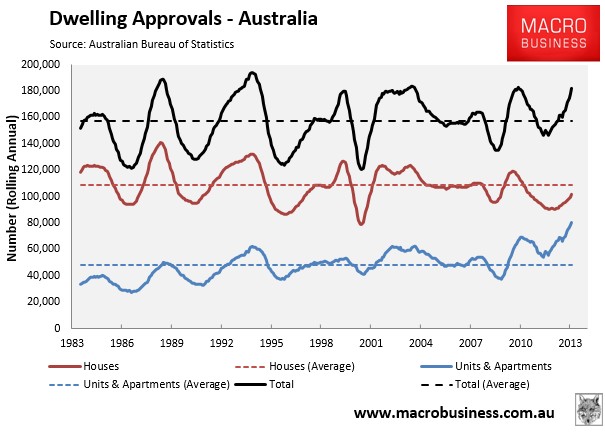
The shift to apartments has been well documented, which are necessarily much smaller than houses (see next chart).
Advertisement
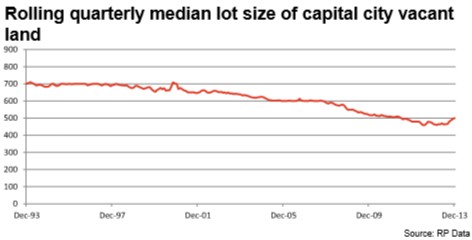
For those households choosing detached housing, lot sizes have shrunk, showing that Australian house buyers are now paying much more but receiving less in return:
The fact is, Australian housing still remains unaffordable compared with pre-2000 norms and a typical Australian is required to work much longer and harder to buy a house currently than was the case throughout much of Australia’s history.
Leith van Onselen is Chief Economist at the MB Fund and MB Super. He is also a co-founder of MacroBusiness.
Leith has previously worked at the Australian Treasury, Victorian Treasury and Goldman Sachs.