
Cross-posted from DFA Blog.
The ABS Australian Social Trends Database is a mine of information on aspects of housing, wealth and population. Following some recent updates, we have been looking at wealth and property trends. Today we discuss some of the findings, which is a “tale of two cities”.
First, here is the data on the number of owner occupied properties added to the Australian portfolio between 1998 and 2012.
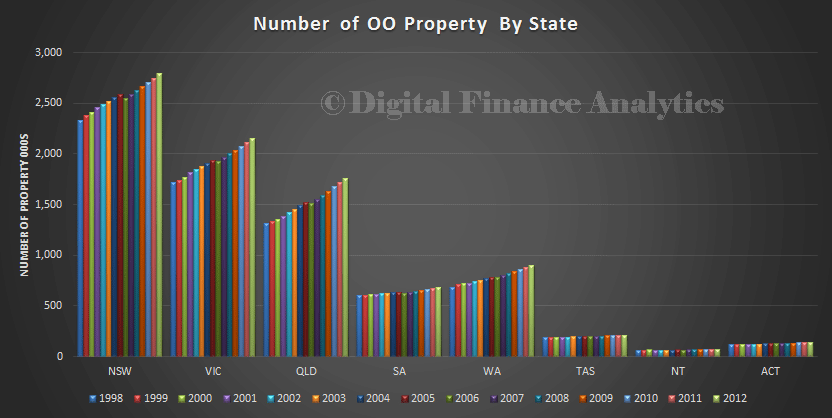
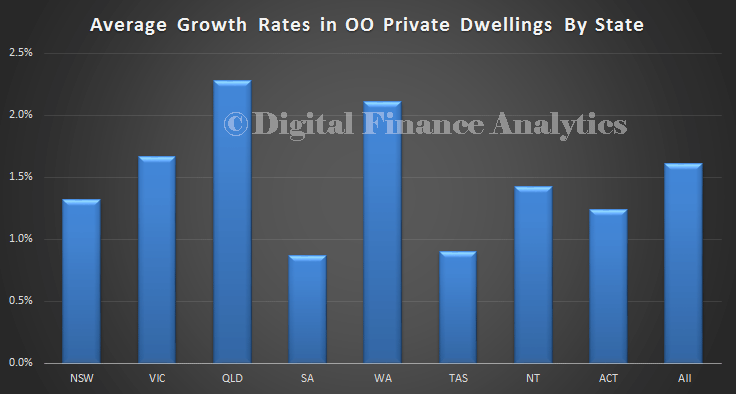
The average growth rates were around 1.5% p.a., but there are significant variations by state:
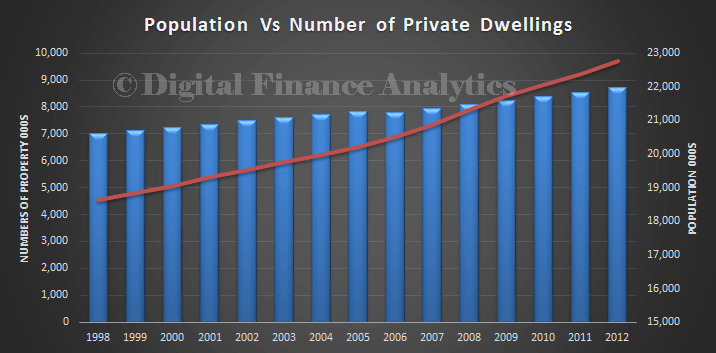
Compared to population growth, the growth in the number of owner occupied property is slower. We estimate we need another 150,000 dwellings to keep pace. The slack is being taken up by rentals, more shared living, and supply/demand pressures lifting house prices.
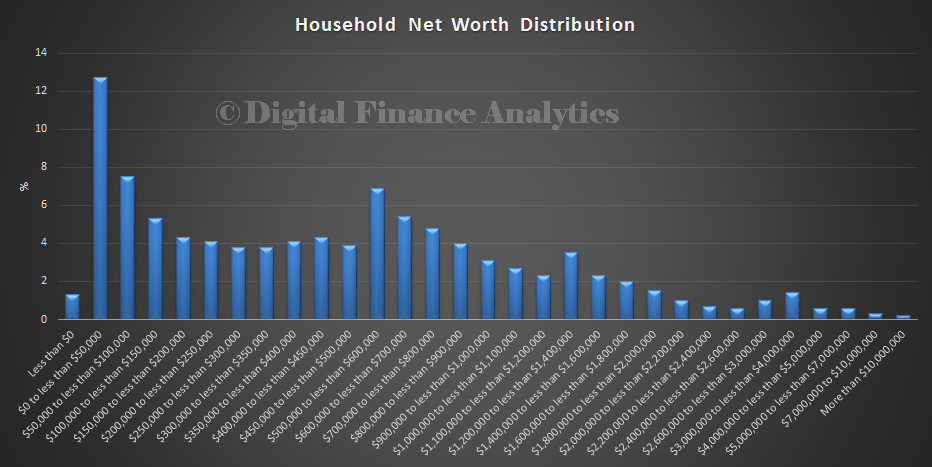
Turning to household wealth, there is an interesting distribution across the relative net worth bands. More than 12% of households have less than 50k net worth. (The blip at 500k-700k is because of the change in ranges the ABS uses)
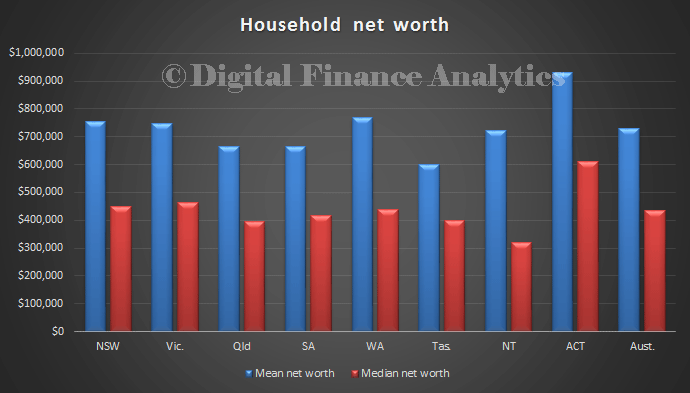
The averages vary by state: with the highest mean in ACT, then WA.
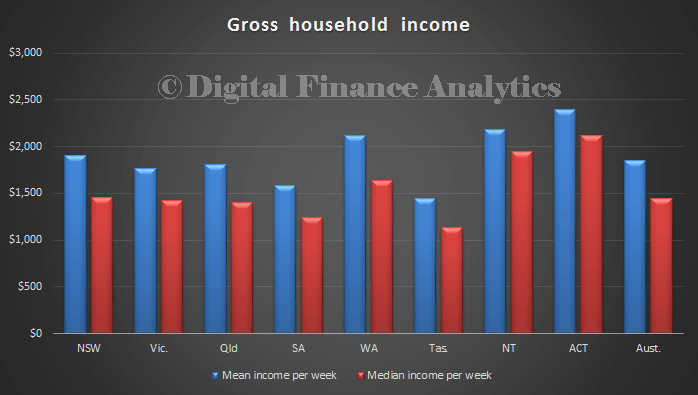
Gross household income also varies by state, with the highest in ACT, then NT and WA. The lowest is in TAS.
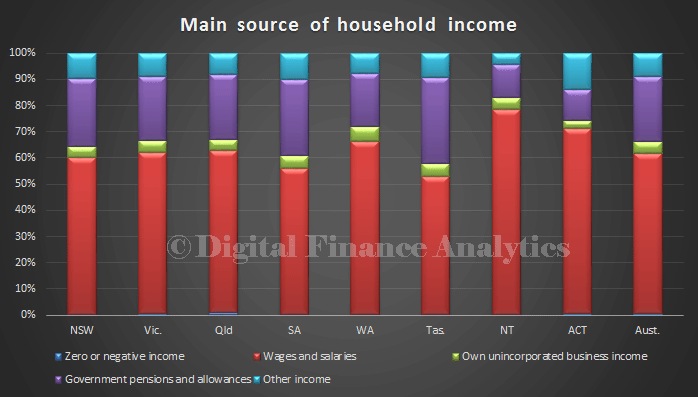
Sources of income vary. Nationally around 60% of households earn wages or salaries, with Government pensions the second highest. TAS has the lowest proportion of households earning, NT and WA the highest.
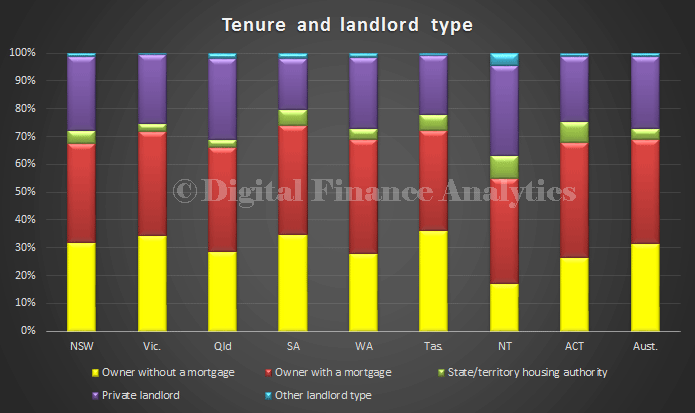
Turning to property tenure, renting is highest in QLD, WA and NT. Households in SA and TAS are a little less likely to have a mortgage.
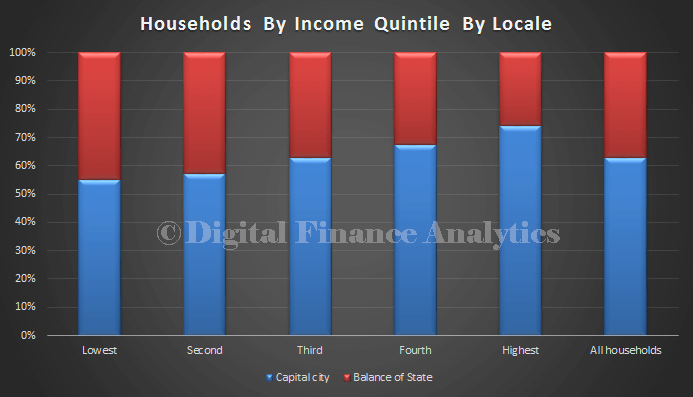
Another way to look at households in by income quintiles. Households away from the main capital cities tend to have lower incomes.
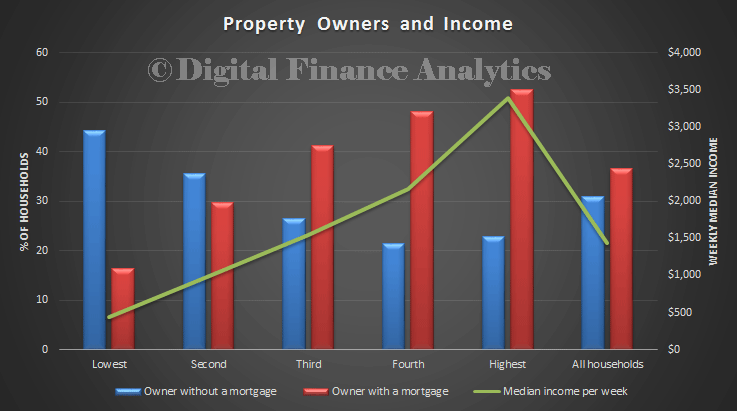
The highest 20% of households have an average weekly income of over $3,500, whereas the bottom 20% households have incomes of under $500. Those with higher incomes are more likely to have a mortgage:
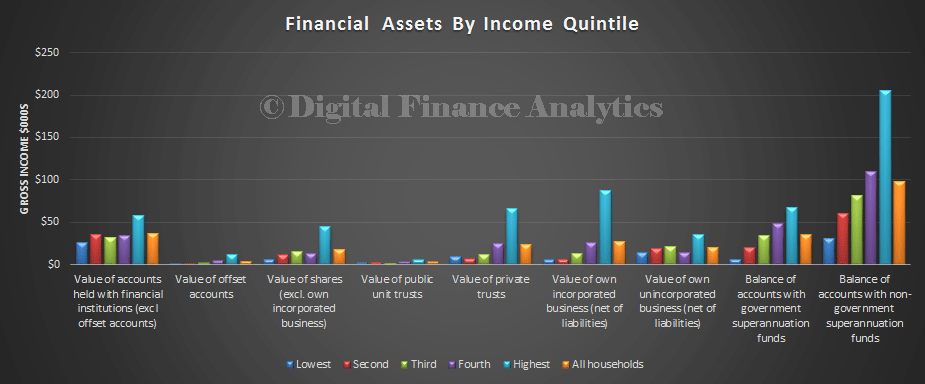
The distribution of financial assets vary across the quintiles, with the average households keeping around 20k on deposit at the bank. Shares, private trusts and businesses feature more at the upper income ranges.
Liabilities also vary by incomes range:
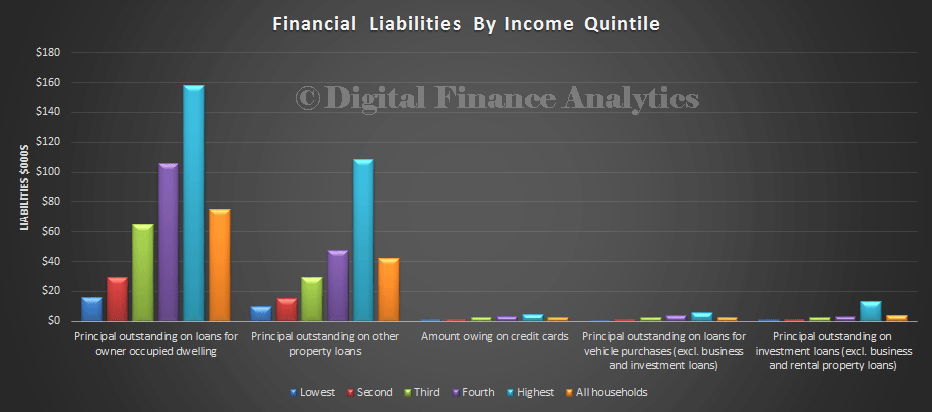
So putting this together, we see a gulf between the “two cities”, lowest income households and the highest. High income households are investing across the asset classes, including property and superannuation. They are also taking advantage of negative gearing, which encourages the use of large mortgages for tax reasons. At the other end of the spectrum, a significant number of households have low or no incomes, are dependent on Government funding, and own little in assets. The contrasts are significant, and in the current environment, with surging property prices and rising unemployment, this polarisation is set to continue.
