
Cross-posted from DFA blog:
Yesterday the RBA published its latest chart pack, which provides a range of pictures from their statistics. One of the most telling charts relates to various household ratio trends. Today we look at those relating to housing.
Here is the chart, which we recreated from the underlying RBA data:
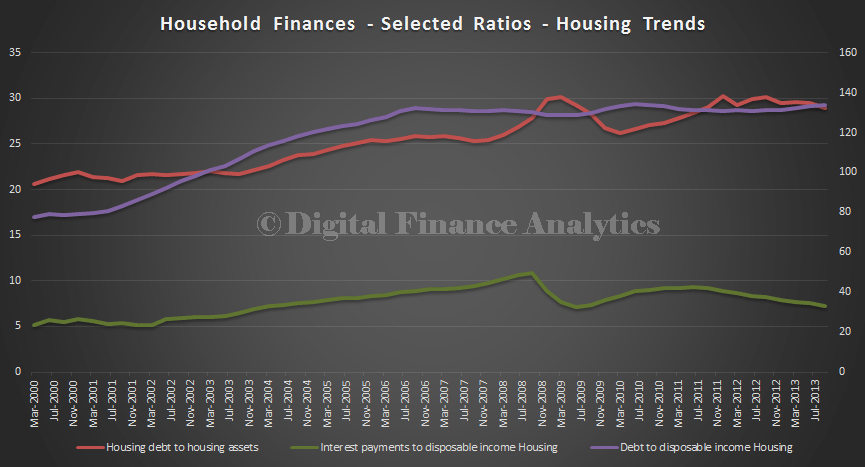
The ratio of housing debt to housing assets is at the top of its range. This is consistent with our earlier analysis showing that households had more debt than ever.
The trend ratio of disposable income to debt is as high as ever it has been. We looked at household disposable income by segment, against house prices recently, and we showed that apart from the most wealthy, income had grown more slowly than house prices, (we used Sydney as an example).
Some have argued recently that house prices have not really grown that much, if you take inflation into account:
“The important thing to keep in mind however is that when you consider inflation, dwelling values remain lower than their previous peaks in every city”.
However, the ratio analysis published by the RBA nicely skirts round this because inflation will be impacting both sides of the calculation, so isolating the results from underlying inflation. The real-life impact of the current housing market is that households are stretched by high prices and big loans. First time buyers are worst hit, which explains why their mortgage stress levels are higher, and many potential first time buyers are sitting on the sidelines.
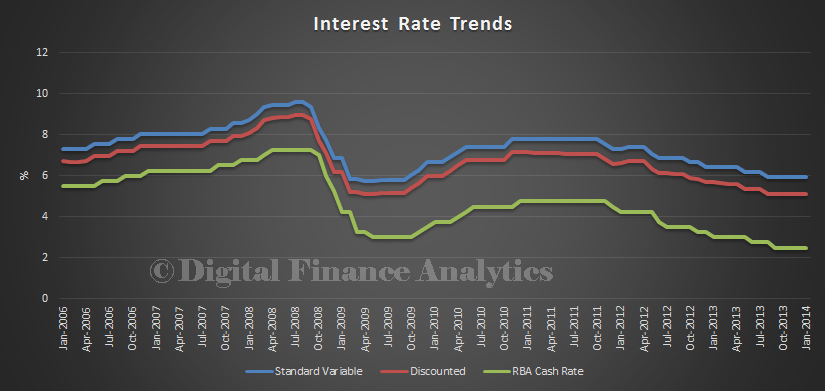
Very low interest rates have made larger mortgages more affordable, which is why the ratio of interest payments on housing to disposable income has come off its 2008 highs. The RBA chart shows movements in the average standard variable rate and discount home loan rate, and we overlaid the RBA cash rate. Note the divergence after 2007, the GFC widened spreads and disconnected market rates from the cash rate to some extent, as funding models and costs changed. Spreads remain extended although funding pressures have eased.
Finally, here is a trend snapshot of average value of new loans.
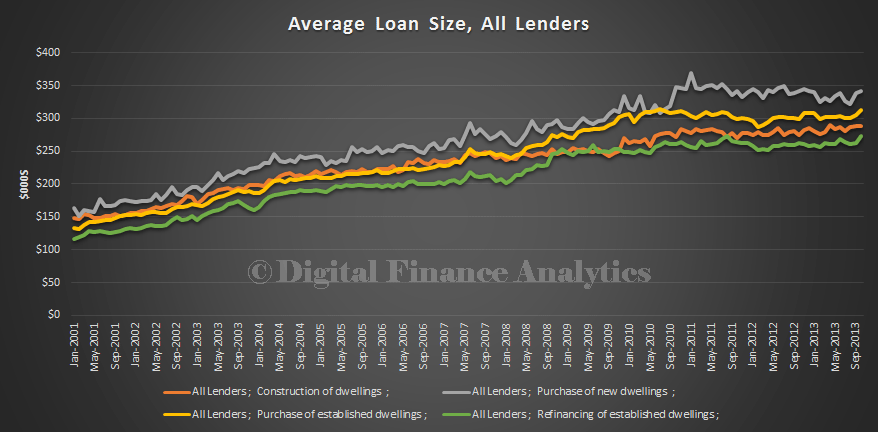
Loans are bigger than before the GFC (2007) indicating that the demand for bigger mortgages is being met by banks.
Overall, the housing affordability situation is not pretty, even at these low rates. By international standards we have sky high prices.
Down the track I see an unfortunate contention. If the RBA needs to raise rates to counter inflationary pressures, it may be hampered by the impact on households with high debt levels. Even small rises in interest rates will have a significant dampening effect. Households are more exposed to potential rate movements than ever.
