

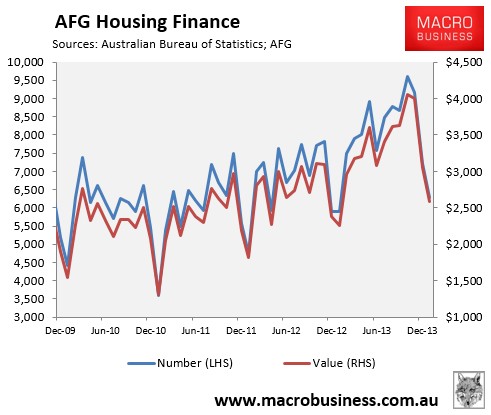
Australian Finance Group (AFG) has released its housing finance data for the month of January, which registered a seasonal 13% decline in mortgage applications over the month, but more importantly (since the series isn’t seasonally-adjusted) a 7% increase in the number of applications over the year. It was also the Group’s strongest January on record, with 6,297 mortgage applications (valued at $2,585 million) processed over the month (see next chart).
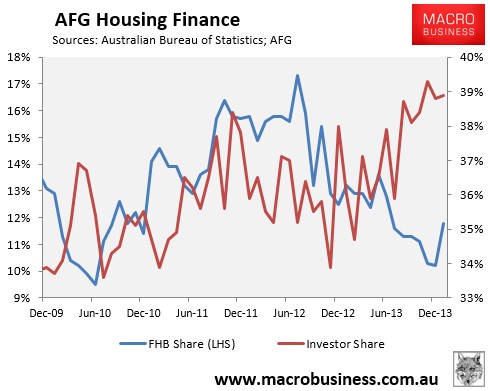
AFG also reported a small increase the first home buyer (FHB) mortgage share in January – from 10.2% to 11.8% – driven by a big pick-up in Victoria (from 8.7% to 11.2%). Here’s how FHB mortgage demand has changed over the year:
- National: 11.8%, down from 13.2% in January 2013;
- New South Wales: 3.4%, down from 4.1% in January 2013;
- Victoria: 11.2%, down from 19.6% in January 2013;
- Queensland: 6.5%, up from 5.3% in January 2013;
- Western Australia: 24.2%, up from 21.7% in January 2013; and
- South Australia: 15.5%, down from 16.6% in January 2013.
However, investors are still driving new mortgage demand, with their share of mortgages at 38.9% in January, according to AFG (see next chart).
Below are the investor shares by major market, as well as the changes over the year:
- National: 38.9%, up from 36.0% in January 2013;
- New South Wales: 53.4%, up from 47.3% in January 2013;
- Victoria: 37.4%, up from 34.8% in January 2013;
- Queensland: 33.5%, down from 34.5% in January 2013;
- Western Australia: 30.9%, up from 28.3% in January 2013; and
- South Australia: 33.9%, up from 31.6% in January 2013.
As you can see, investors accounted for a whopping 53.4% of all mortgages in New South Wales in January – the highest share in the six years AFG has been running its monthly Mortgage Index.
As noted previously, some caution should be exercised in interpreting AFG’s figures and extrapolating its results to the overall mortgage market, as measured by the Australian Bureau of Statistics (ABS).
AFG’s data measures mortgage applications, whereas the ABS measures actual mortgage commitments. According to AFG’s General Manager of Sales & Operations, Mark Hewitt, just over three quarters of applications on average become mortgage commitments, although this figure can obviously fluctuate month-to-month. AFG’s market share has also been rising in recent years.
Therefore, while AFG is a useful guide as to the strength of mortgage demand, its results do not necessarily translate to the overall mortgage market as captured later by the ABS.
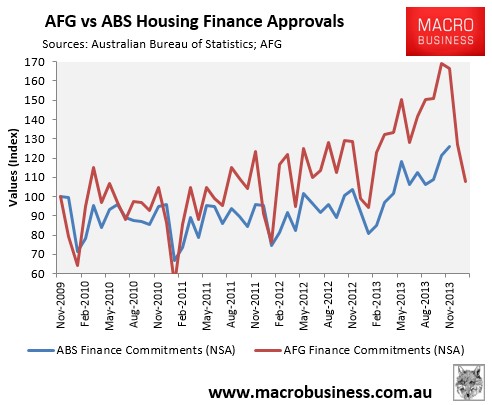
To illustrate, consider the below chart showing how the growth of AFG mortgage applications has diverged significantly from ABS mortgage commitments since November 2009:
Nevertheless, the AFG data supports the ABS housing finance release for November (the latest available), which revealed a continued dominance of investors in the mortgage market, particularly in New South Wales.
