
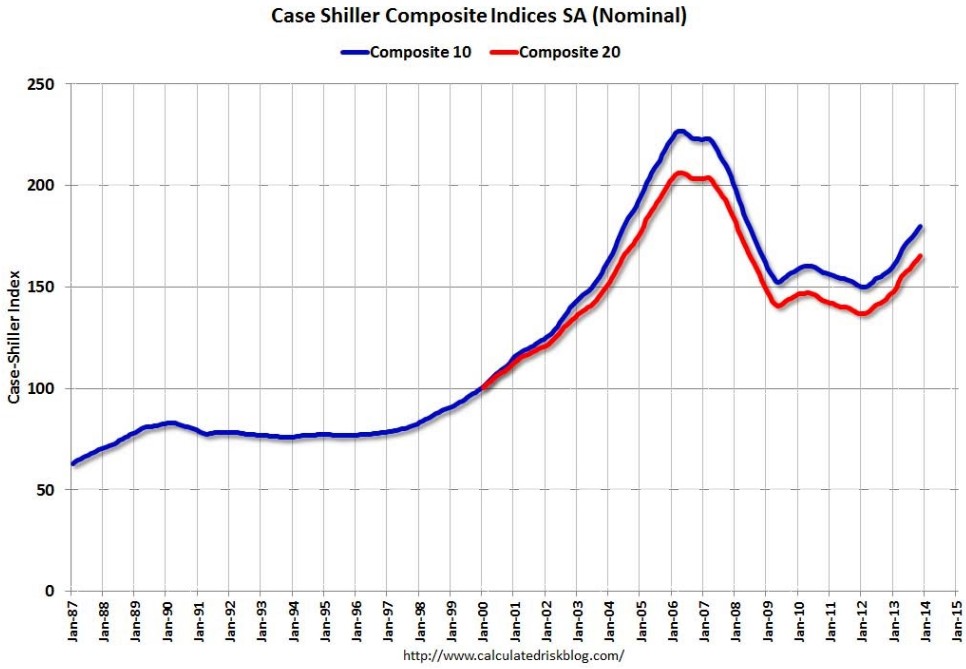
The 20-city Case-Shiller house price index for November was released overnight, which registered 0.9% seasonally adjusted growth in November to be up 13.8% over the year – the strongest annual growth rate since February 2006 (see next chart from Calculated Risk).
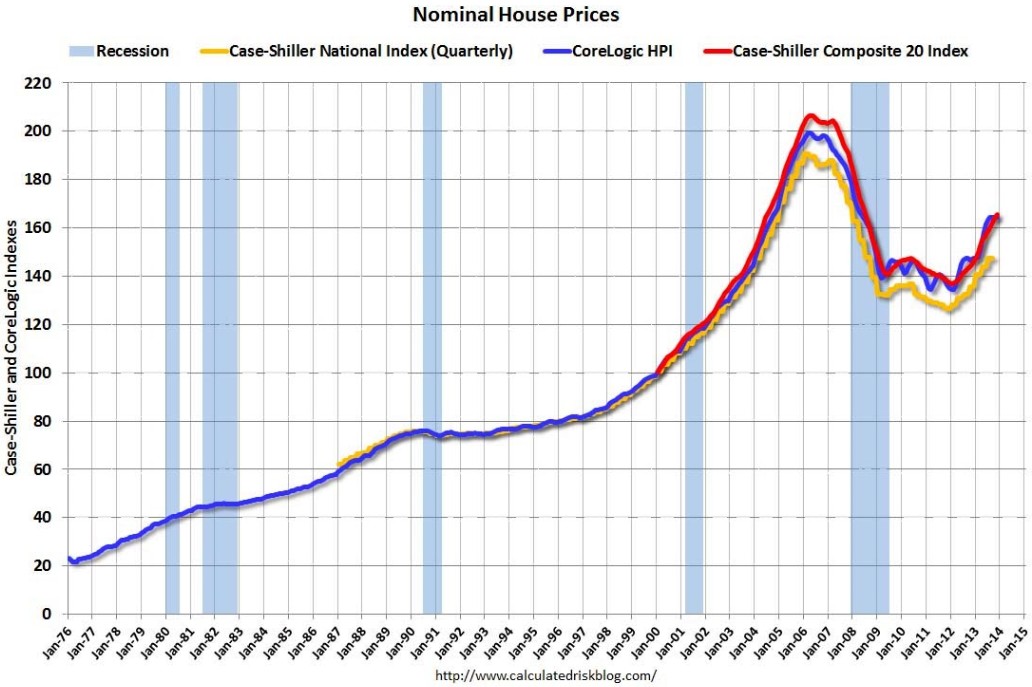
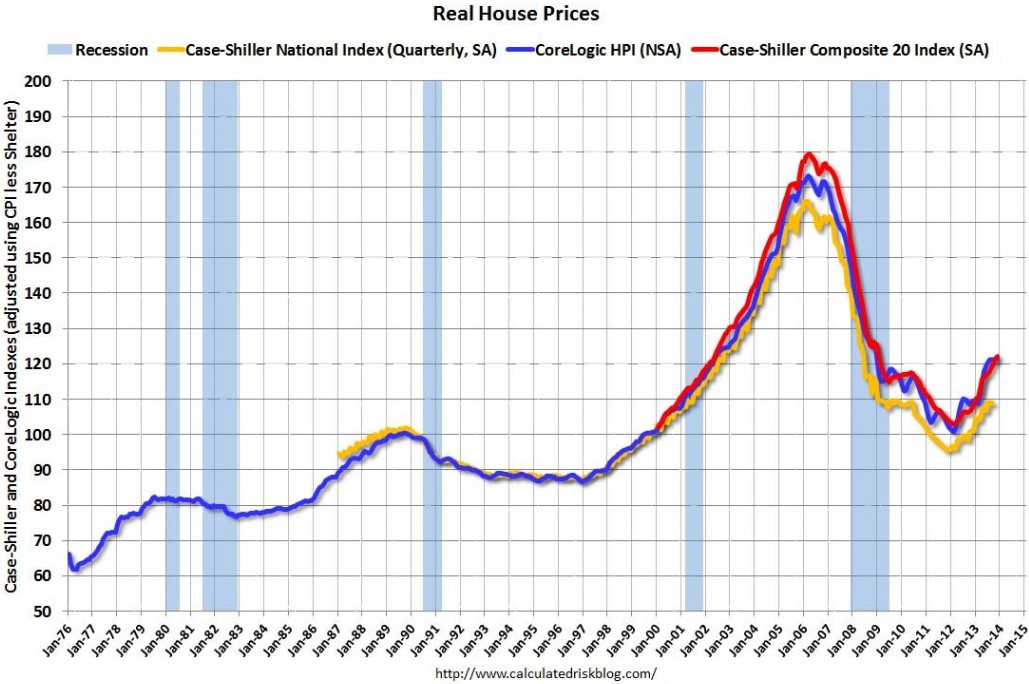
The below charts, which again come from Calculated Risk, show the state of play in US house prices.
First, nominal house prices, as measured by Case-Shiller and Core Logic, show that values are back at 2004 levels:
In real terms, US house values are back at early-2000 levels:
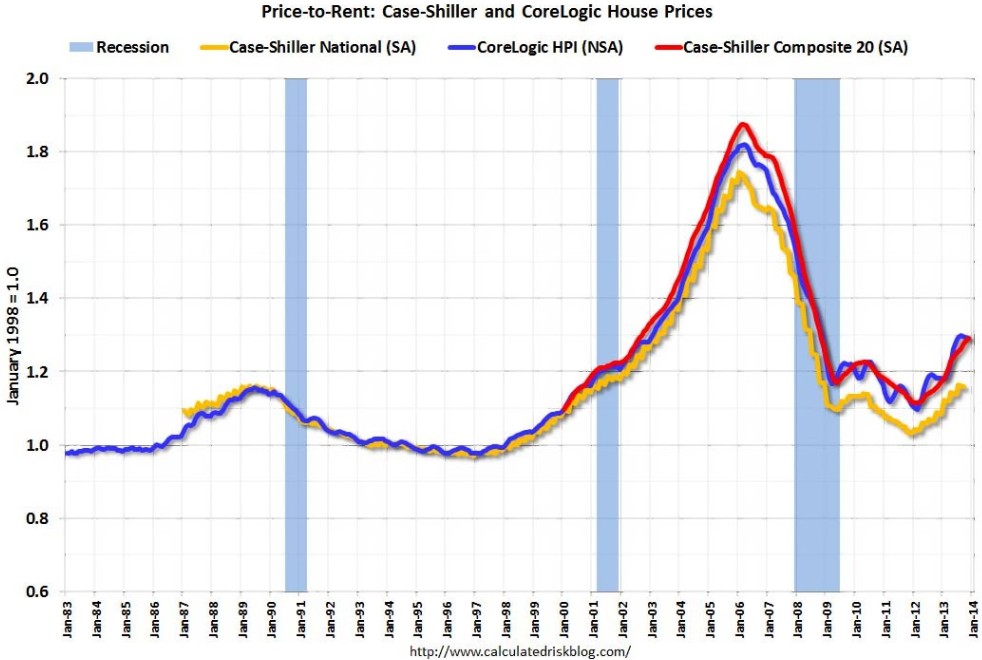
As are US house prices relative to rents:
And the next chart shows the bubble peak, the post bubble minimum, and current nominal prices relative to January 2000 prices for all the Case-Shiller cities in nominal terms:
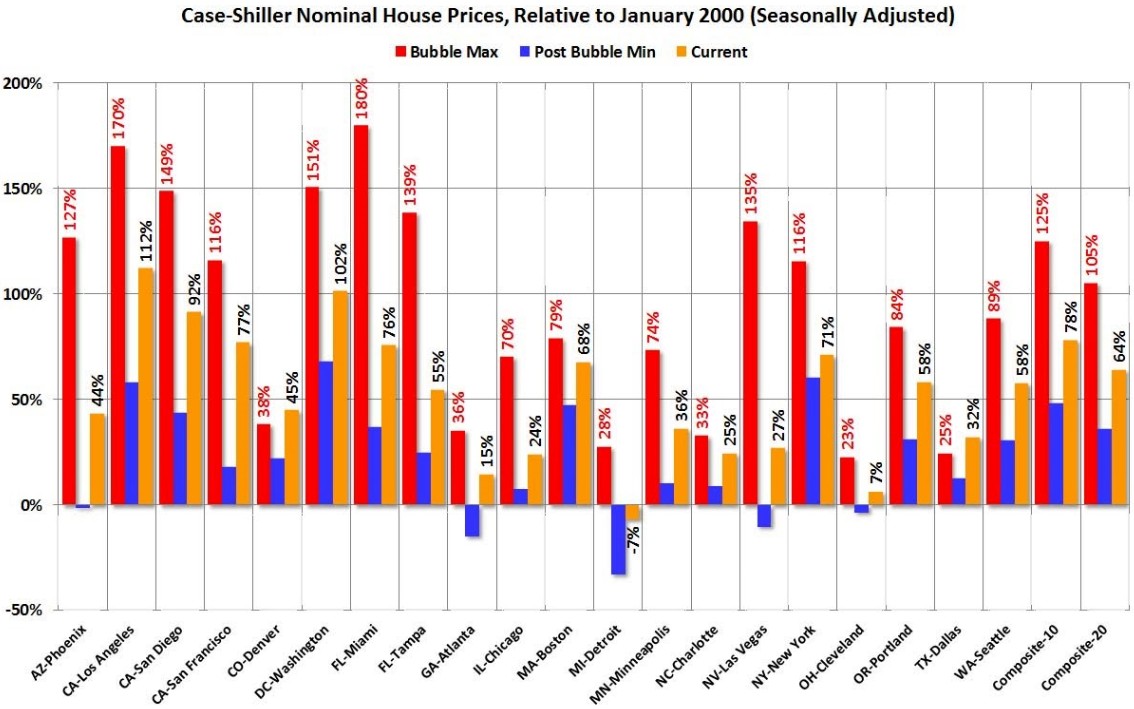
Not the huge volatility present across the supply-restricted markets (e.g. West Coast, Las Vegas, Arizona, Florida, North East), and the relative stability experienced elsewhere. Most markets, however, remain below their peak.
Finally, US new home sales remain in the gutter. Despite 16.4% growth over the year and the highest level of sales since 2008, 2013 was still the sixth worst year on record. Calculated Risk has provided an interesting chart showing the “distressing gap”, which shows existing home sales (left axis) and new home sales (right axis) through December 2013.
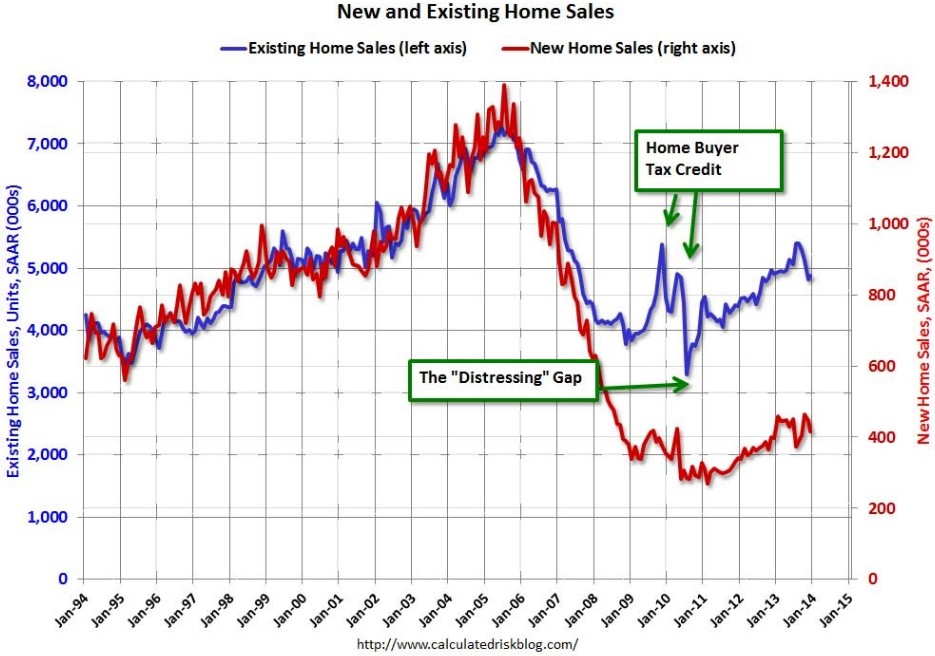
Following the US housing bust, the flood of distressed sales kept existing home sales elevated and depressed new home sales, since builders were unable to compete with the low prices of all the foreclosed properties.
unconventionaleconomist@hotmail.com
