There’s been a wide array of data released over the past two weeks, some of which was covered briefly by Economic Delusion last week. Below is a summary of the key releases by the RBA/ABS, which paint a mixed picture on the Australian economy.
Investors drive housing credit growth higher:
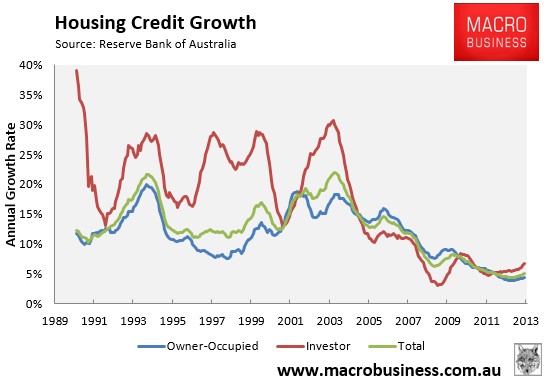
As is customary, the RBA released its private sector credit aggregates for the month of November on the last day of 2013, which revealed an ongoing acceleration in housing credit growth led by investors.
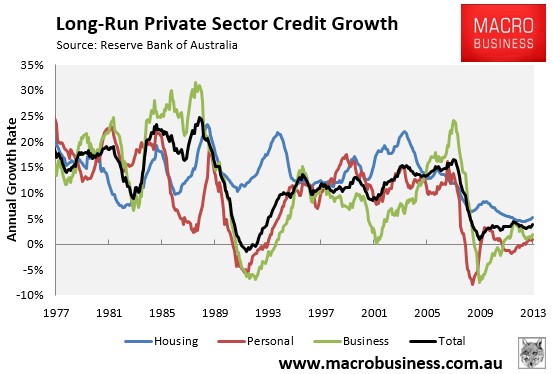
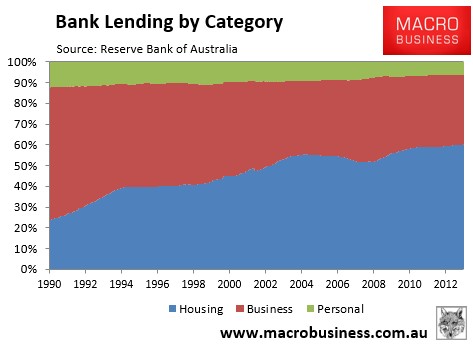
The next chart shows the breakdown by category over the long-term, with all components – business (-0.1% MoM; -0.1% QoQ; 1.9% YoY); housing (0.5% MoM; 1.5% QoQ; 5.15% YoY); and personal (0.0% MoM; 0.2% QoQ; 0.8% YoY) – subdued relative to long-term experience, but picking-up from recent lows:
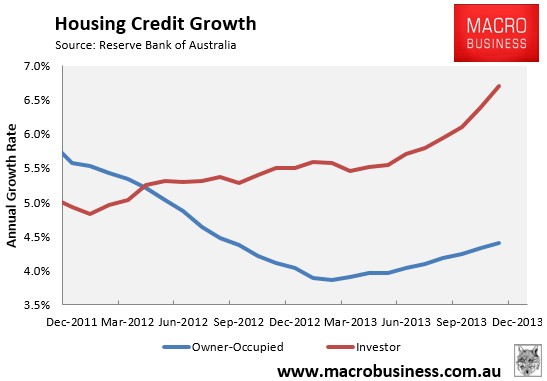
As has been the trend recently, housing credit growth continued to accelerate, driven primarily by investors (0.73% MoM; 1.99% QoQ; 6.70% YoY), which are outrunning owner-occupiers (0.42% MoM; 1.24% QoQ; 4.41% YoY):
Housing’s share of private credit growth also hit a record high of 60.2% in November, with its share more than doubling since the early 1990s at the expense of business lending (see next chart). So much for productive investment!
Falling AUD offsets commodity price fall:
On New Year’s Day, the RBA released its Index of Commodity Prices for the month of December 2013, which revealed an ongoing decline in overall commodity prices in Special Drawing Rights (SDR) terms (essentially a measure of prices using a basket of currencies), but an increase in commodity prices in Australian dollar (AUD) terms.
Over the month of December, commodity prices fell by 1.0% in SDR terms to be 4.0% lower over the year, whereas prices rose by 3.3% in AUD terms, with prices 11.7% higher over the year:
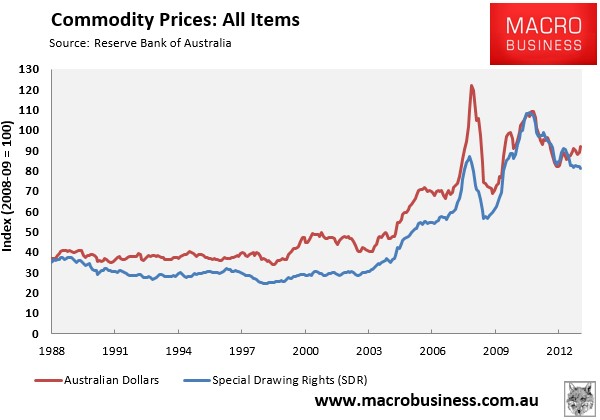
Over the December quarter, commodity prices fell by 1.8% in SDR terms, suggesting that the terms-of-trade will show another negative result when the December quarter national accounts are released, which would obviously act as a drag on national income growth.
Australia ramps-up dependence on China:
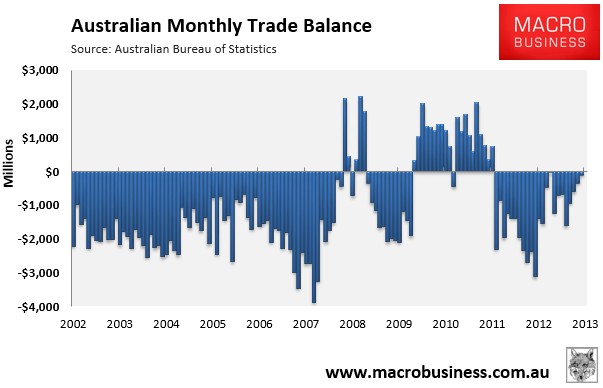
International trade data released last week by the ABS revealed an improving trade position, with Australia’s trade deficit declining to $118 million from $358 million in October, although it was the 23rd consecutive monthly deficit (see next chart).
One worrying aspect from the result is that it suggested an increasing dependence on one commodity (iron ore) and one trading partner (China), with iron ore hitting a record 29.5% share of total exports and China’s share hitting a record 39.8% share:
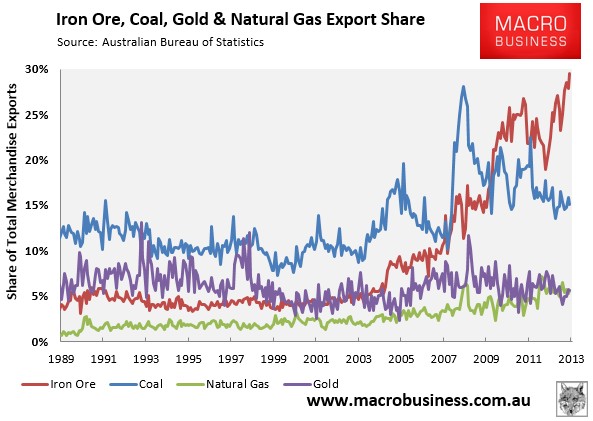
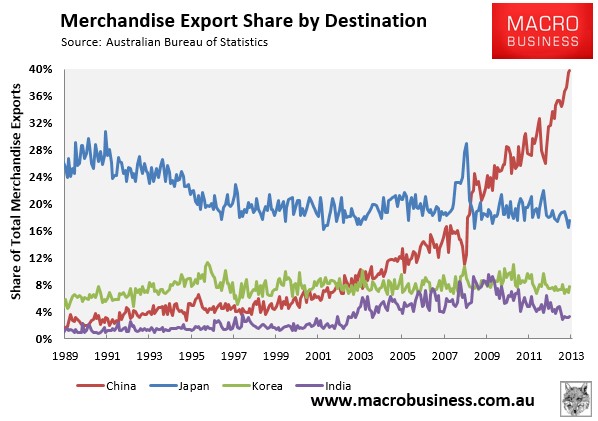
With increased concentration comes increased risk for the Australian economy.
Discretionary spending lifts retail sales:
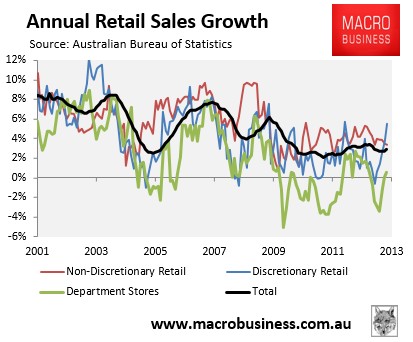
Retail sales data released by the ABS showed an ongoing pick-up in retail sales, which rose by 0.7% in November to be up by a solid 4.6% over the year. The lift was driven by discretionary retailing, which hit its highest annual rate of growth since June 2012 (see next chart).
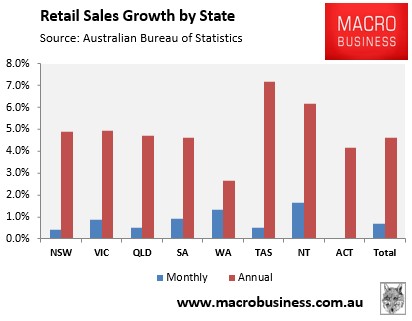
Retail sales also rose across all states and territories:
Dwelling approvals dip, but trend is up:
Dwelling approvals data released last week by the ABS for the month of November 2013 contracted by a seasonally adjusted 1% over the month, driven by a 9% fall in the volatile units & apartments segment, with house approvals rising by 6%. Over the year, total dwelling approvals rose by 22%, with both house (17%) and unit & apartment (28%) approvals lifting.
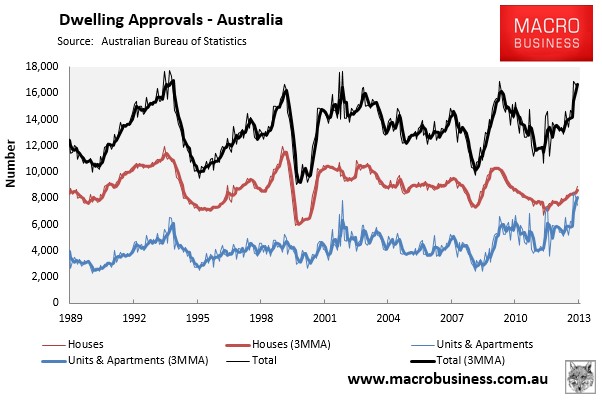
Dwelling approvals are now running above their long-term average levels, driven entirely by units & apartments:
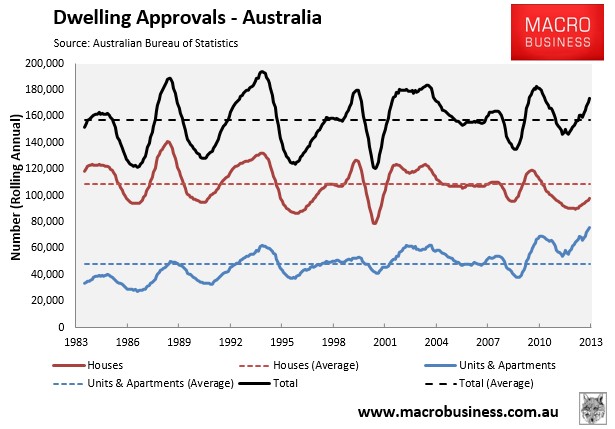
However, as noted previously, with Australia’s population some 45% bigger than the early-1980s, construction levels remain subdued on a population-adjusted basis.
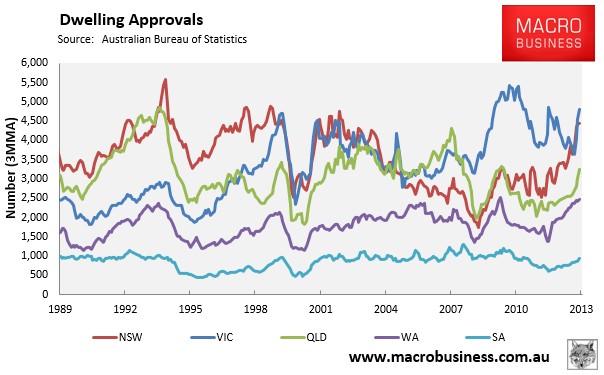
Looking at the mainland states, you can see that approvals are trending-up across all major markets:
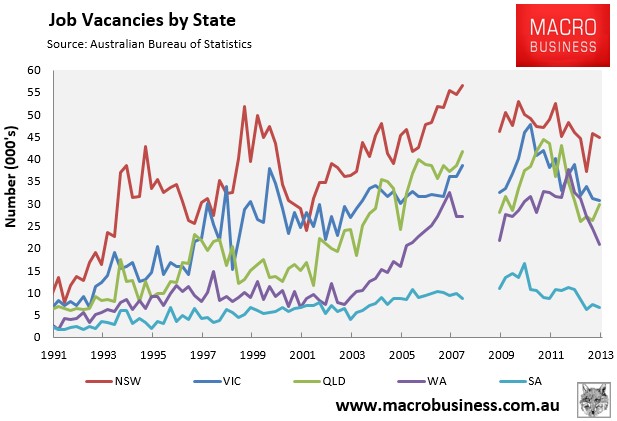
Job vacancies stabilise:
Finally, job vacancies data released last week by the ABS for the November quarter suggested stabilisation, although they remained near GFC lows:
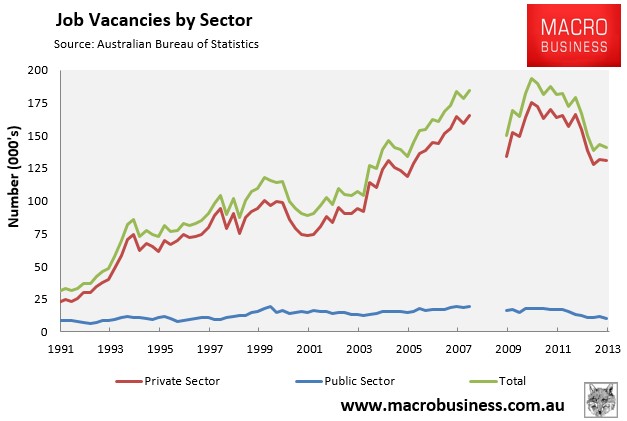
That said, there is wide divergence across states, with vacancies plummeting in Western Australia: