From Bloxo today, we’re all suddenly singing from the same hymn sheet, more or less:
Australia’s potential growth rate looks to have fallen in recent years, with our model suggesting that it may be closer to +2.8% y-o-y, rather than the +3.5% it averaged between 2000 and 2005. Poor productivity growth has been a key driver of this slowdown, as the pace of reform has slowed. A less flexible labour market, an inefficient tax system and poor infrastructure have all contributed to slower productivity growth. A stymied reform agenda has been one of the ‘curses’ of the resources boom, as the easy success of rising commodity prices discouraged reforms.
As well as productivity, an economy’s supply potential is also determined by the capital at its disposal and the people that are available to work. With regard to the latter, there are fewer people willing and able to report for duty, with the employment-to-population ratio falling. This partly reflects the aging of workforce, but also, that weak domestic demand has discouraged job search for some people over the past year or so.
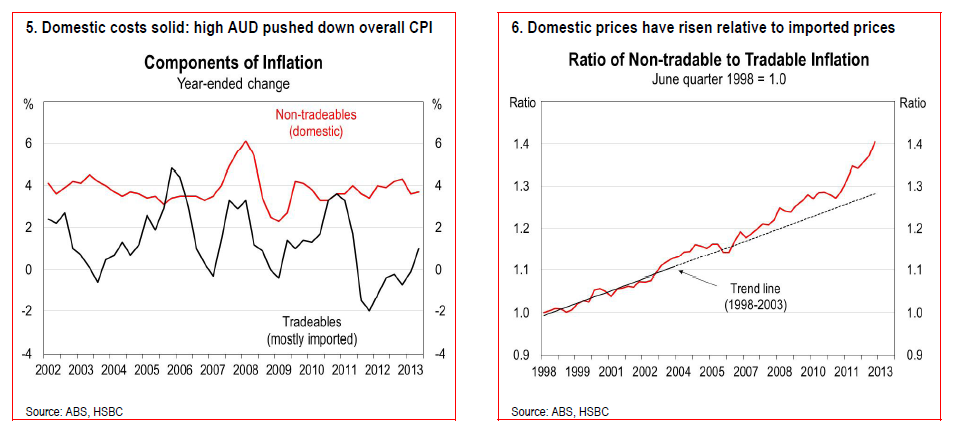
The recent pick-up in underlying inflation is consistent with the view that Australia’s potential growth rate may have fallen. Locally produced (non-tradables) inflation has remained high in recent years, despite a loosening labour market. Overall inflation has been held down by an elevated AUD, with imported goods prices falling, but with the AUD now lower, overall inflation looks to have passed its trough.
Lower potential growth means that Australia has less room to accommodate any pick-up in demand, as it could more quickly translate into rising inflation. It is also likely to mean that the natural rate of unemployment may be higher than it has been in the past – it could be closer to the current level (5.8%) than the 5.0% rate that used to be the case. This could leave the RBA with less room to move to support demand than previously.
A key challenge for policymakers is to focus on reforms to lift Australia’s potential growth rate and support on-going growth in living standards in coming years.
The three Ps: population, participation and productivity
An economy’s potential growth rate is the pace at which the economy can operate in the long term, without putting sustained upward pressure on inflation. Estimating potential GDP, however, is a tricky business and the concept is one of the great ‘unobservables’ in macro-economics.
A flick through a standard economics textbook suggests that potential output is determined by three key factors. First, the amount of people available to work in the economy, reflecting the size of the population, its age structure and the hours people are willing and able to work. Second, the stock of productive capital, like factories, roads, ports, mines and the electricity network. The final factor is productivity, which is the efficiency with which the economy uses the other two factors to produce goods and services.
To estimate potential growth, we combine all these ingredients into a standard Cobb-Douglas production function, using estimates of the economy’s capital and labour and treating productivity as a residual. Our method is fairly standard and follows that outlined by the US Congressional Budget Office, with the finer details outlined in some previous work (see: Bloxham, P. (2012) ‘Downunder Digest: Australia’s productivity challenge’, 29 February).
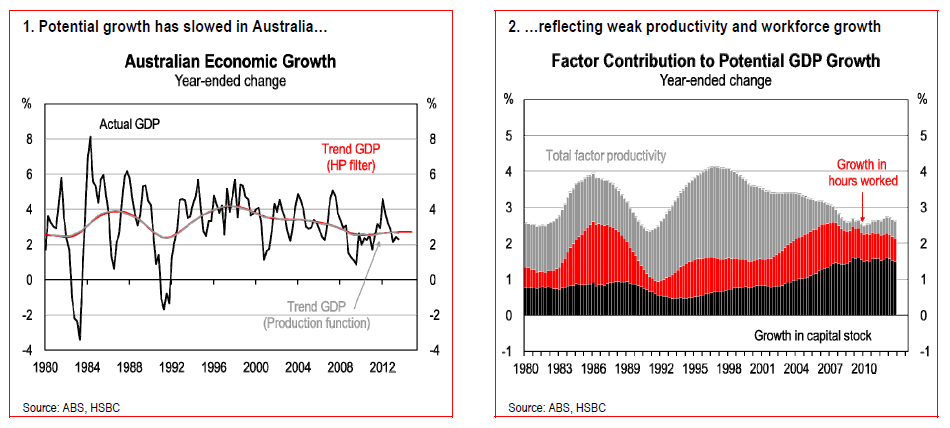
Our estimates suggest that Australia’s potential has probably slowed down in recent years. Estimates from a production function approach and a simple Hodrick-Prescott filter (which averages growth over time) show Australia’s potential growth rate sitting around +2.6-2.8% in recent years (Chart 1).
This is well down on potential growth rate estimates of closer to +3.5% in the early 2000s.
Two of the three key ingredients have contributed to this slowdown (Chart 2).
First, growth in the labour force has slowed and this has hampered the supply potential of the economy.
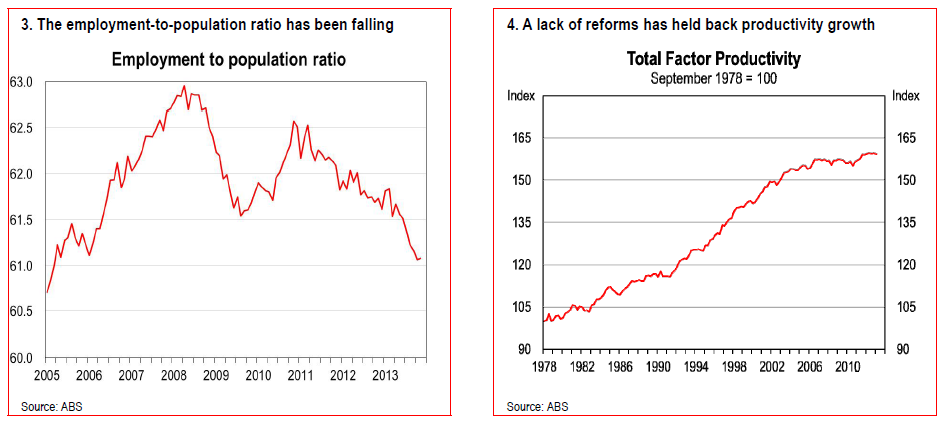
This has reflected mostly a fall in the employment-to-population ratio in recent years, due to an aging population, but also reflects weaker demand, which has reduced the willingness of people to work, as employment prospects have weakened (Chart 3).
Second, productivity growth has slowed substantially in recent years (Chart 4). Total factor productivity growth has slowed down to an average annual rate of +0.5% a year, down from a much faster +2.2% a year from 1991 to 2003.
Productivity has been weakest in the mining and utilities sectors. For mining, this is likely to be at least partly temporary, reflecting that there has been significant investment in the sector, which has involved labour and capital, but there has been little measured output, as yet, because the ramp-up in exports still has quite some time to run. For utilities, weak productivity growth partly reflects increased reliability of service standards in recent years, which has increased the ‘quality’ of electricity and water provision, but not the quantity. For electricity, this has involved building significant capacity to meet peak demand= levels, even though much of this capacity is underutilised at other times; for water, investment in desalination plants has also weakened measured productivity as this is an expensive way to acquire water.
But productivity growth has slowed across all sectors of the economy, suggesting that there are also macro-economic factors at work.
Australia’s reform agenda, which had great momentum in the 1980s and 1990s, has stalled over the past decade. This has left Australia with an inefficient tax system, a less flexible labour market and a lack of quality infrastructure. A stymied reform agenda has been one of the curses of the resources boom, as the easy success of rising commodity prices discouraged reforms (see Bloxham, P. (2011) ‘Does Australia have a resources curse? The challenges of managing a mining boom’, 18 August). Tax reform, regulatory reform and investment in infrastructure all took a backseat as Australia rode the mining boom wave.
Implications for inflation
If Australia’s potential rate of growth is lower than it used to be, a key implication is that the economy will be unable to grow as quickly as in the past, without putting upward pressure on inflation. This means that any boost to demand could quickly chew through spare resources and generate cost pressures.
The recent pick-up in underlying inflation is consistent with the view that Australia’s potential growth rate may have fallen. Despite GDP only growing at around +2.3%, inflation appears to have passed its trough, with the underlying measures running at 2.6% y-o-y, up from a low of 2.0% in mid-2012. This3. The employment-to-population ratio has been falling 4. A lack of reforms has held back productivity growth reflects the fact that domestically produced inflation remains elevated, with non-tradable inflation still tracking at a rate that is above the RBA’s target band in recent quarters. For a number of years this solid domestically produced inflation has been offset by falling imported goods prices, as the AUD has been at high levels. But with the AUD falling, tradables inflation has started to rise, causing the overall CPI inflation to start to rise, driven by domestic costs (Chart 5). The rise in the ratio of non-tradables goods and services prices relative to tradables goods and services prices is a symptom of weak productivity growth and competition in the local economy (Chart 6).
Even the RBA seems to (implicitly) hold a view that potential growth has slowed. While the central bank does not publish its estimates of potential, the latest round of forecasts (from November) showed inflation tracking around the mid-point of the target in 2014, despite the RBA’s own forecast that the economy would only grow by around 2.5% in 2014. Potential must have slowed in the RBA’s view, if the economy is to maintain inflation at the mid-point of the target despite only modest growth (the RBA was also assuming a currency holding steady at 0.95 US cents at the time).
Less room to move
All of this could add up to less room to move on monetary policy. With underlying inflation already just above the mid-point of the target band, at 2.6%, and the AUD having fallen in recent months, inflation could rise from here despite growth remaining well below average and the unemployment rate having risen. It may be that rates will have to rise at lower rates of growth, or higher rates of unemployment, than in the past. It also emphasises to policymakers the importance of productivity-enhancing reforms.
Bottom line
Our estimates suggest that Australia’s potential growth is probably around 2.8% a year, down from 3.50% between 2000 and 2005.
A combination of weak productivity growth, reflecting the slow pace of economic reform, along with weak labour force growth have likely driven this deterioration.
As a result, the Australian economy could be more prone to rising inflation at slower growth rates and higher unemployment rates, suggesting that the RBA may have less room to move to support the economy.
David Llewellyn-Smith is Chief Strategist at the MB Fund and MB Super. David is the founding publisher and editor of MacroBusiness and was the founding publisher and global economy editor of The Diplomat, the Asia Pacific's leading geo-politics and economics portal.
He is also a former gold trader and economic commentator at The Sydney Morning Herald, The Age, the ABC and Business Spectator. He is the co-author of The Great Crash of 2008 with Ross Garnaut and was the editor of the second Garnaut Climate Change Review.