
Cross-posted from DFABlog.
Today we delve further into the segmented analysis of savers, using the DFA household survey data. This follows my previous post which highlighted that different segments are savings quite differently.
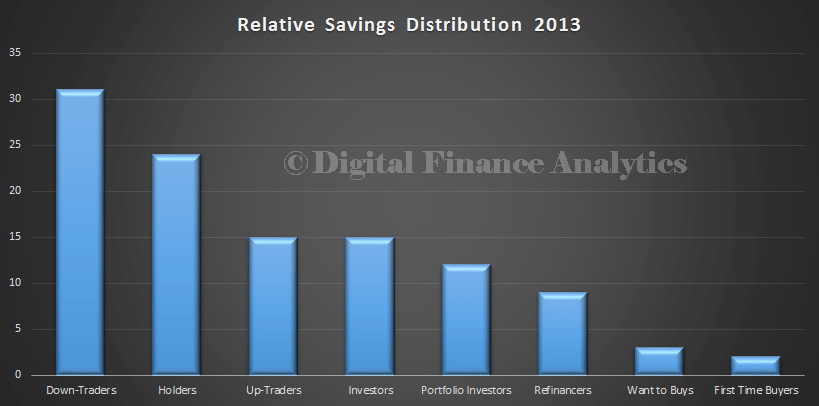
First, we look at the relative value distribution of savings across segments. I used an index methodology to provide a relative picture across segments, rather than a specific dollar value. It shows that generally older households save more, which is what we expect, given the distribution of mortgages across the age ranges.
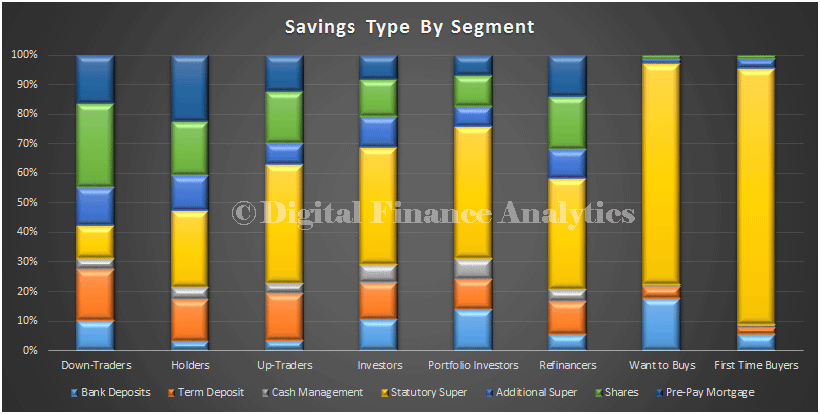
If we then look at the different savings options being used by the segments we see important differences. I have excluded property from the analysis, due to the less liquid nature of this asset class. For some segments, statutory super is the main savings mechanism, whereas for other segments their savings portfolios include shares, term deposits, as well as making additional superannuation contributions beyond the statutory level.
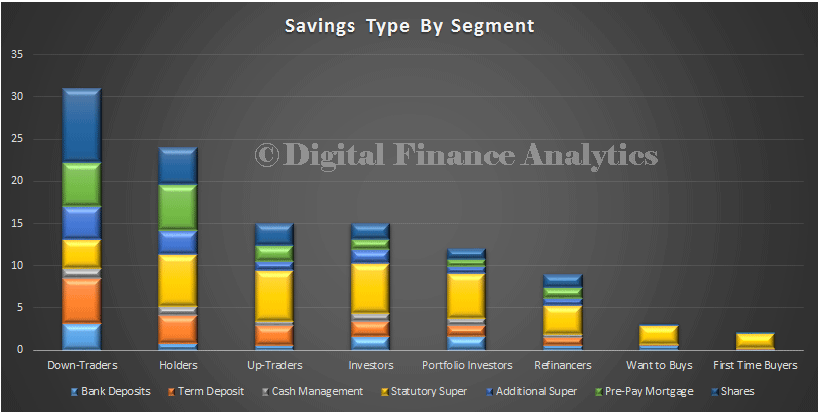
Marrying the two data sets, gives a relative value distribution by segment.
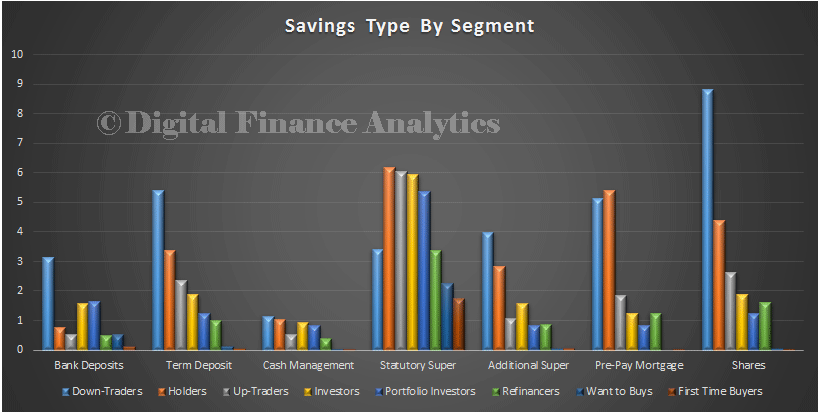
We can also rearrange the data by main savings categories. We see how the mix changes by segment.
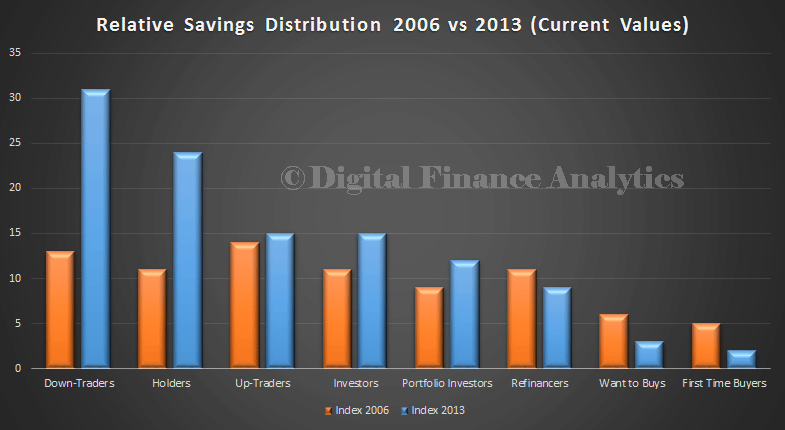
Going back to the value distribution by segment, we also ran a comparison between 2006 (when the savings ratio was lower) and now. This nicely shows the shifts across segments (note 2006 values were restated to 2013 values for comparison).
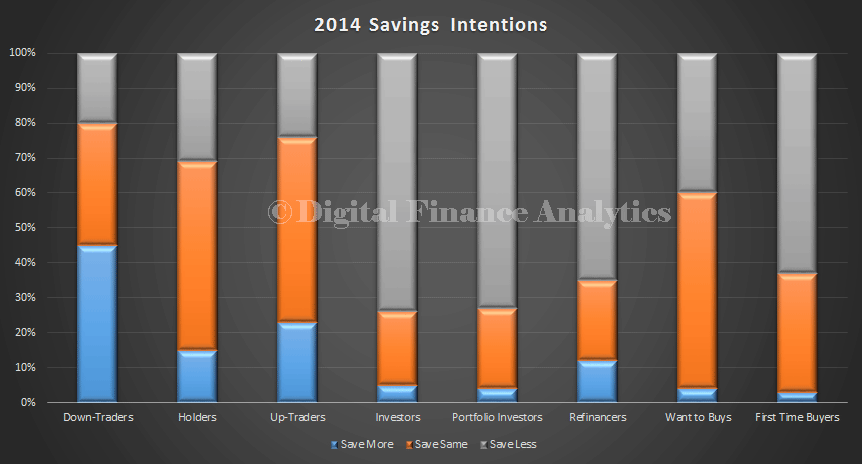
Finally, we extracted savings intentions by segment for 2014. Given the RBA is desperate to encourage more spending to support growth, it makes interesting reading. Those with the greatest propensity to save will continue to do so, Investors will save less as they pursue investment properties, and First Time Buyers, and Want To Buys will be saving less, under costs of living pressure.
So, what does this tell us? Well, first, I think it is unlikely we will see a flip from savings to spending anytime soon. Yesterday’s MYEFO highlighted rising national debt, and rising unemployment, both factors likely to reduce household confidence. In any case, we know that those in savings mode are there for longer term security reasons, building a buffer for later life. This is not going to flip.
Second, it is true that a proportion of savings is forced, through superannuation, and so the net savings ratio mixes discretionary and non-discretionary savings. For some segments, super aside, they hardly save at all, living from day to day.
Third, there may be a realignment of savings vehicles, thanks to the low bank deposit rates, many savers are looking at shares or property as an alternative. Actually this is introducing more risks into savings portfolios, something which the RBA seems quite happy about. As Glenn Stevens said in his opening remarks to the House of Representatives Standing Committee on Economics today “The returns to savers for holding safe assets have commensurately declined, and this has clearly prompted substitution towards other assets, including equities and dwellings”.
I suspect their thinking was that as returns fall and risks increase, this may stimulate more spending. Our survey suggests that households who are in savings mode will continue to save, and actually lower interest may well encourage even greater saving. Low interest rates are not a path to stimulate spending in the current environment for many.
Finally, I think we see significant inter-generational issues in play. Some say it has always been this way, but the relative wealth distribution seems more skewed in 2013, thanks to rising property values, significant savings by some, and significant borrowing by others.
2014 looks like a year of saving, not spending.
This is the last post for 2013. I wish readers happy holidays, and DFA will be back with fresh analysis next year.
