
Cross-posted from DFA blog.
The Australian Bureau of Statistics provides lending for housing statistics each month, and they provide some good data points. However, when you start to dig into the data, it gets quite interesting. We know from our surveys that non-bank lending is on the rise, and that some of the higher loan to value deals are being provided here. But, who precisely are the non-banks, how are their lending portfolios reported, and do we see any rise coming through in the data?
The ABS split lending into banks and non-banks. They say “together with banks and building societies, at least 95% of the Australian total of finance commitments is covered, and at least 90% of each state total is covered. While many smaller contributors to the Non-Banks series are excluded under these coverage criteria, at least 70% of finance commitments by wholesale contributors are covered”
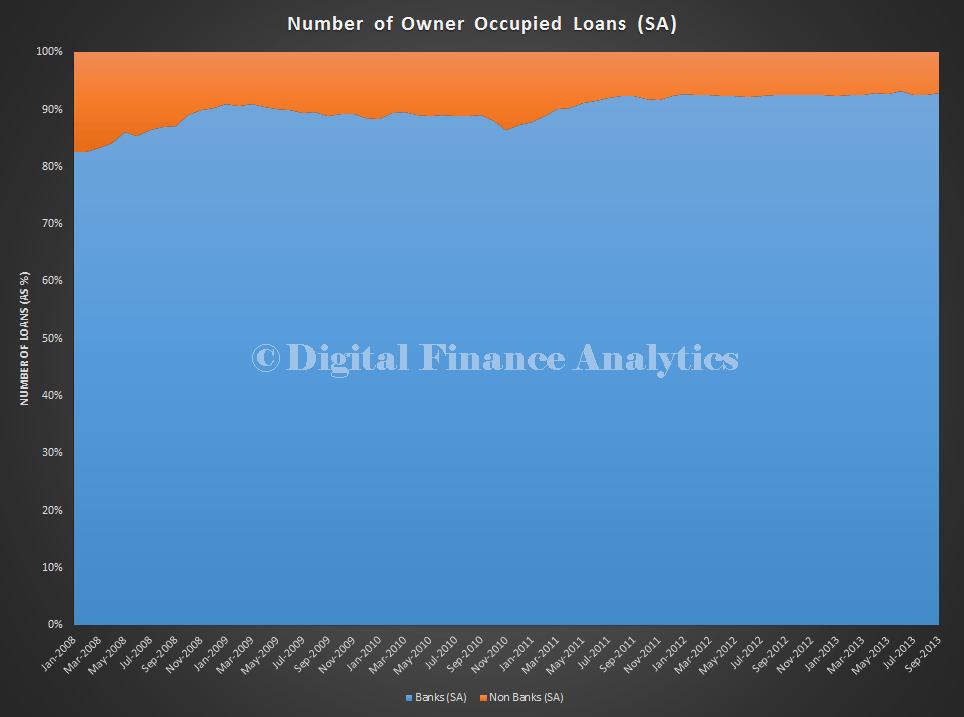
So, the top line view of lending (and here I will concentrate on owner-occupied data) is as follows. Non-Banks are about 10% of the market, plus or minus.
Its when you start to drill into the non-bank data, things get really interesting. ABS tells us “Housing loan outstandings are classified to the following lender types: Banks; Permanent Building societies; Credit unions/cooperative credit societies; Securitisation vehicles; and Other lenders n.e.c.. The first three of these types are components of the grouping Authorised Deposit-taking Institutions (ADIs). Loan outstandings for the ADI lender types are published monthly, and are classified by purpose (owner occupied housing or investment housing). All other institutions, including securitisation vehicles, are only available on a quarterly basis. The release of loan outstandings data for those lenders reporting on a quarterly basis will be lagged by one month – for example March outstandings for securitisation vehicles and other lenders n.e.c. will be released from the April publication onwards.”
So, here is the non-bank data to September 2013. These are the raw numbers, before any seasonal adjustments or trending. The number and value are pretty static, but some data will be quarterly, lagging by a month.
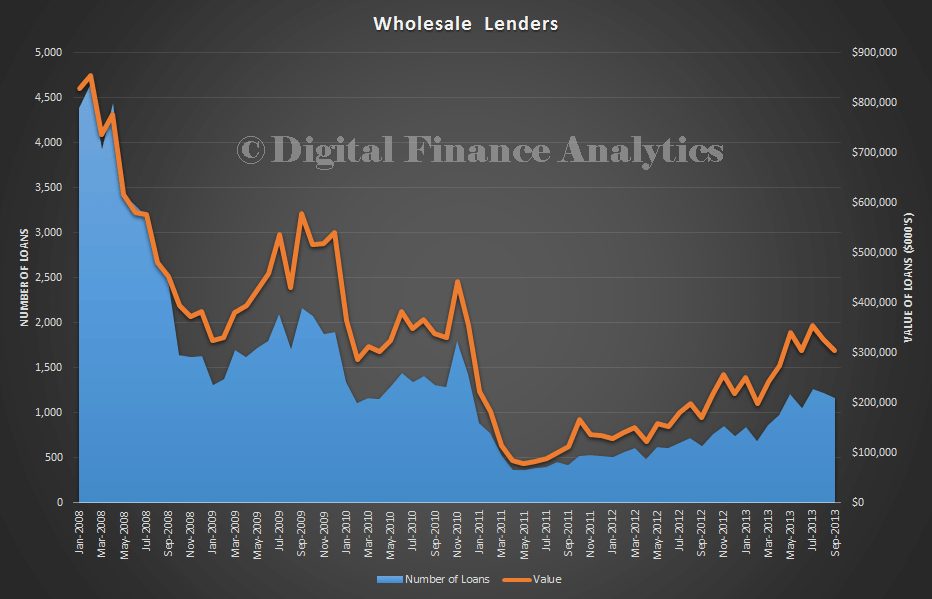
Within the non-bank sector, ABS tells us that “The Wholesale Lenders series almost exclusively comprises securitisation vehicles (typically special purpose trusts), established to issue mortgage backed securities. It excludes commitments where a bank or permanent building society, acting as a wholesale provider of funds, is the lender on the loan contract. Those commitments are published as bank or permanent building society commitments.” 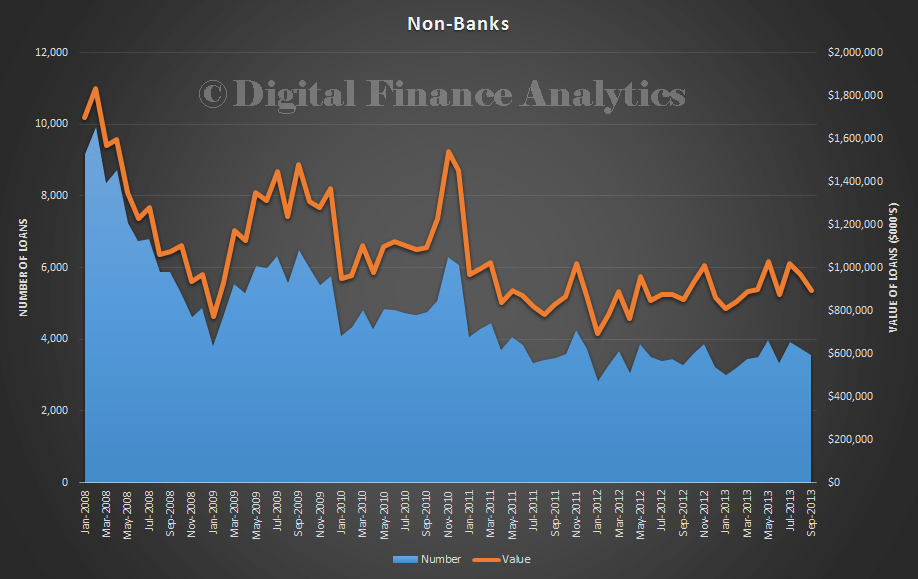
Here is the wholesale data to September 2013. It shows growth in recent months, both in terms of value and volume. We noted recently the changing mix of securitised deals.
But that leaves quite a gap in the non-bank data, which I think is becoming quite important.
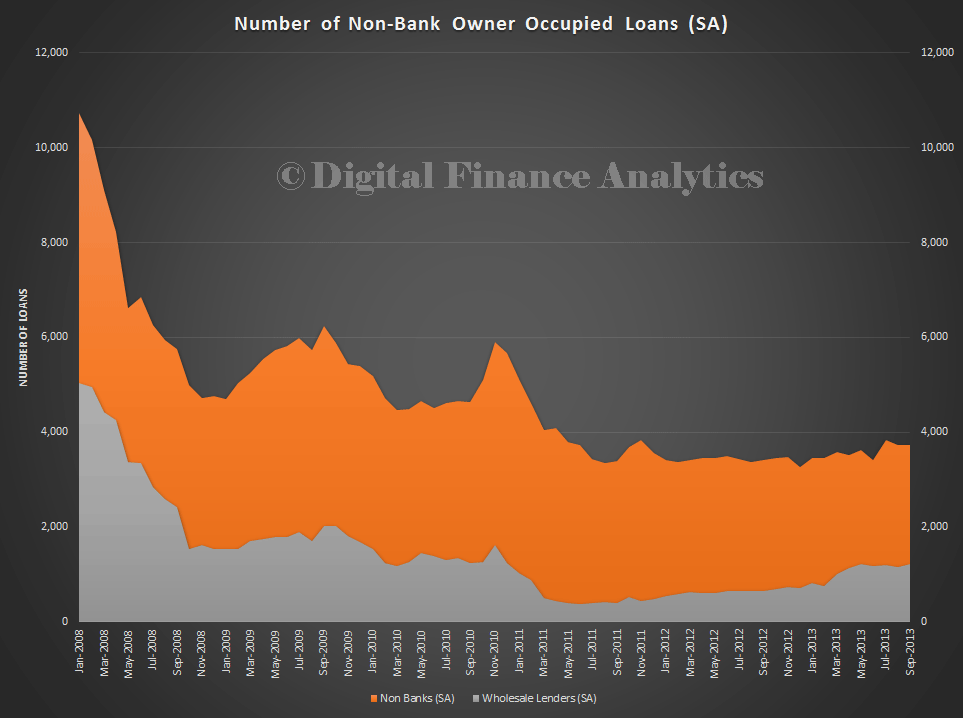
The orange area are loans which are made by non-banks, but funded by direct, or indirect investment, not securitisation. It is not accounted for by banks offering wholesale funding to a non-bank lender where the bank is the lender on the contract. Some non-bank lenders have become quite active, funded privately by investors, and others have received large cash injections from banks and other institutions. But do we see whats really going on in this section of the market? Is it a large enough sector to want more detail?
Lets assume a major bank makes a direct investment in one of the small non-bank lenders. Consider how this would be reported and the capital allocations which would be made. Its not clear to me that the major would have to report the loans in the normal way, rather it would appear in the balance sheet as an arms length investment. This is separate to any consolidation for accounting purposes.
The non-bank lender who received the funds, which may be from a bank, or private investors, may be small enough not to appear on the ABS radar, or simply rolled up into the non-bank reporting. The non-bank would be the lender on the loan contract. These non-bank lenders have more freedom to make higher LVR loans, and may charge prospective borrowers a premium. APRA data does not include non-banks. There is a rise in mortgage brokers directing clients to these non-banks.
Whilst more competition is better, this looks like an area where we would benefit from more detailed data inclusion from the ABS. We really have no idea how big this issue may be. But it seems to be a mystery worth trying to solve!
