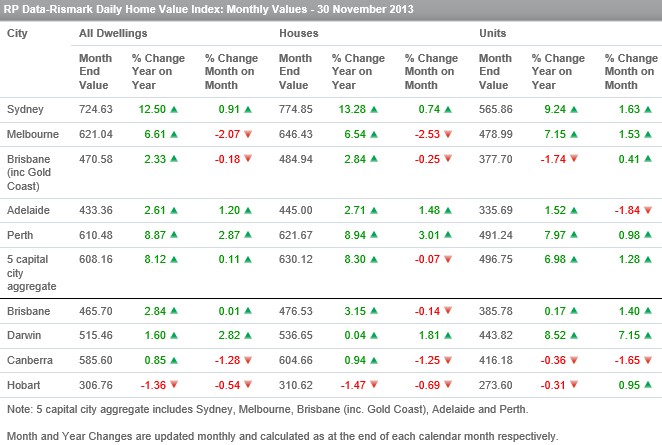
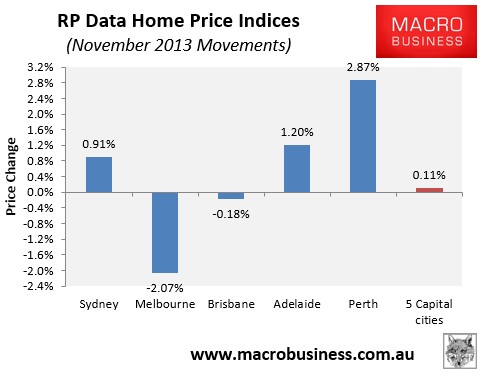
RP Data’s price results are in for November, with the daily index recording a 0.11% rise over the month at the 5-city level, with values rising in three capitals and falling in two (see next chart).
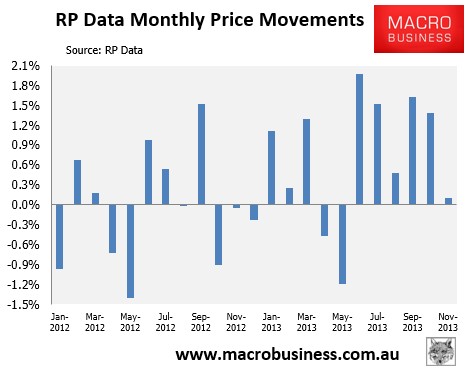
It was the sixth consecutive monthly increase in values, with values also up by 3.12% over the quarter (see next chart).
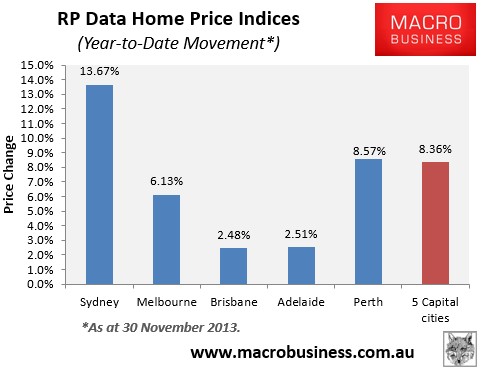
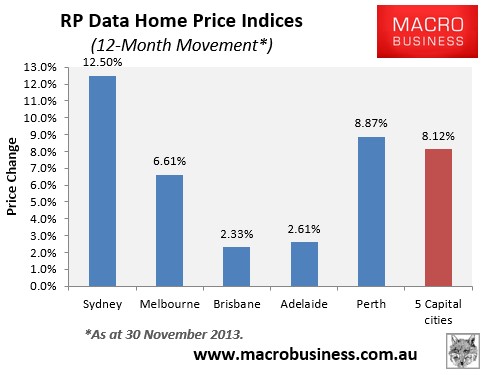
Home values have now increased by 8.36% since the start of the year at the 5-city level and by 8.12% over the past 12 months, driven by strong growth in Sydney and Perth (see below charts).
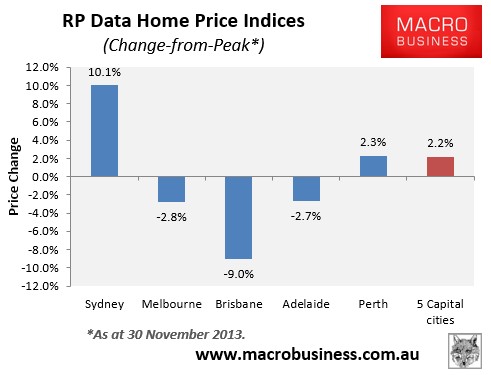
Values are now up 2.2% from their October 2010 peak at the 5-city level, with all major capitals except Sydney and Perth still underwater (see next chart).
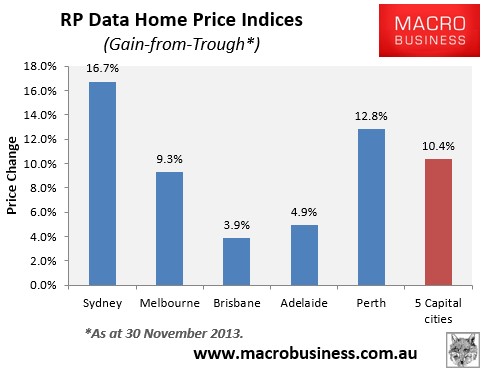
However, values have gained 10.4% since their May 2012 trough, with all capital rebounding from their respective lows (see next chart).
Results for the smaller capitals, which are not tracked on a daily basis by RP Data, are shown in the below table: