

One of the most notable aspects of the recent uplift in home prices is the prevalence of investor activity, which appears to be crowding-out first home buyers (FHBs).
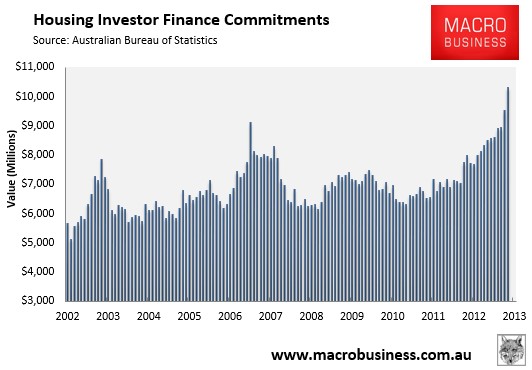
Today’s housing finance data, summarised earlier, continued this trend, with first home buyer (FHB) demand failing to launch, despite nominal mortgage rates at near multi-decade lows. Meanwhile investor finance continues to reach for the stars, jumping by 8% in October, 29% over the year, and hitting the highest level on record (see next chart).
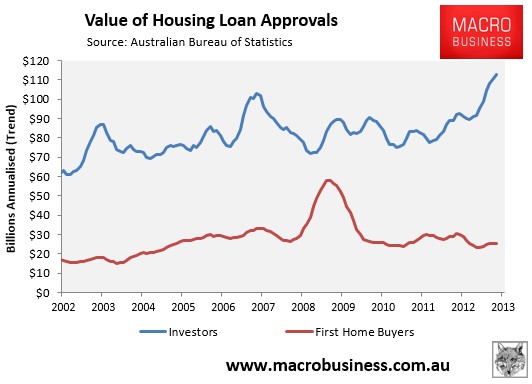
Charting the value of investor finance against FHBs shows the divergence more clearly, with the former powering and the latter remaining in the gutter:
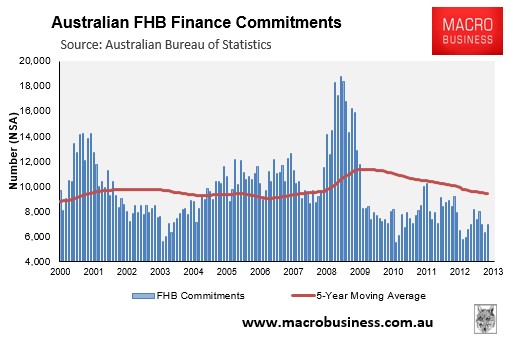
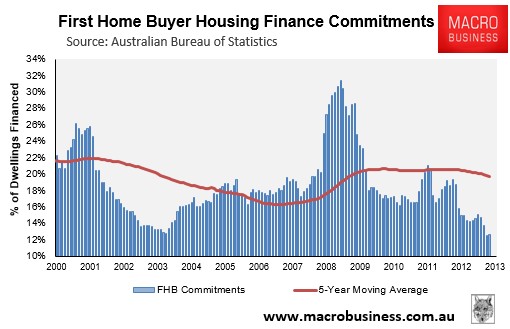
As noted in my earlier post, while the number of FHB commitments nationally jumped by 10% (non-seasonally adjusted) in October – recovering the prior month’s falls – they were down 24% over the year. They also represented just 12.6% of total owner-occupied commitments – the second lowest share on record (see below charts).
Looking at the state-by-state break-down, you can see that the FHB retreat has been driven by New South Wales and Queensland, where grants on pre-existing dwellings were cancelled in October 2012, as well as Victoria, where commitments have fallen sharply following the removal of FHB subsidies from 1 July (see below charts).
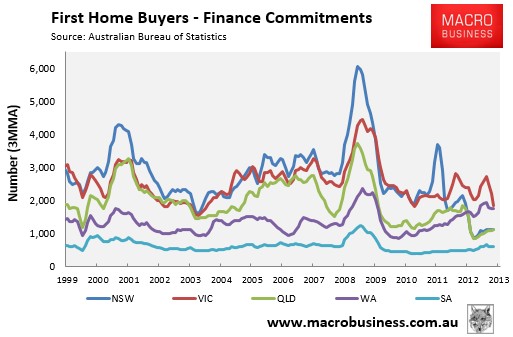
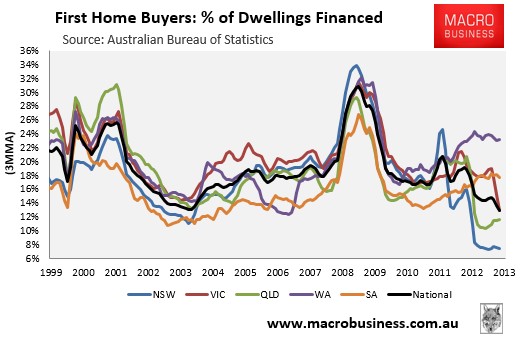
Whereas the FHB share was just 12.6% nationally in October, well below the 5-year moving average (5YMA) of 19.7%, the shares in New South Wales and Queensland were just 7.4% and 11.7% respectively, down from 5YMAs of 18.9% and 18.1%. Victoria’s FHB share also fell to 11.7%, down from 19.6% in June and a 5YMA of 20.9%.
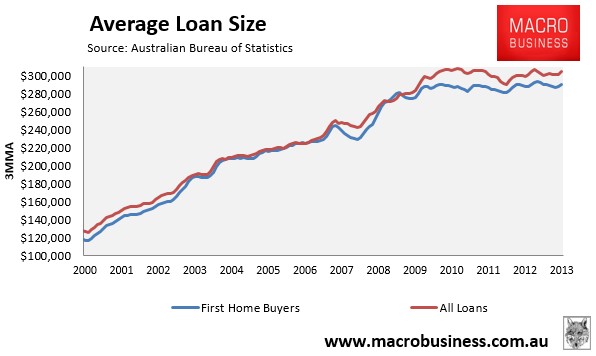
A final interesting observation is that the average loan size for FHBs has shown only minimal growth in more than four years. Since March 2009, the average FHB mortgage has grown by only 4.5%, whereas the average mortgage for the market as a whole grew by 12.0% (see next chart).
As noted earlier, this is undoubtedly an investor led market.
