
Cross-posted from Digital Finance Analylics.
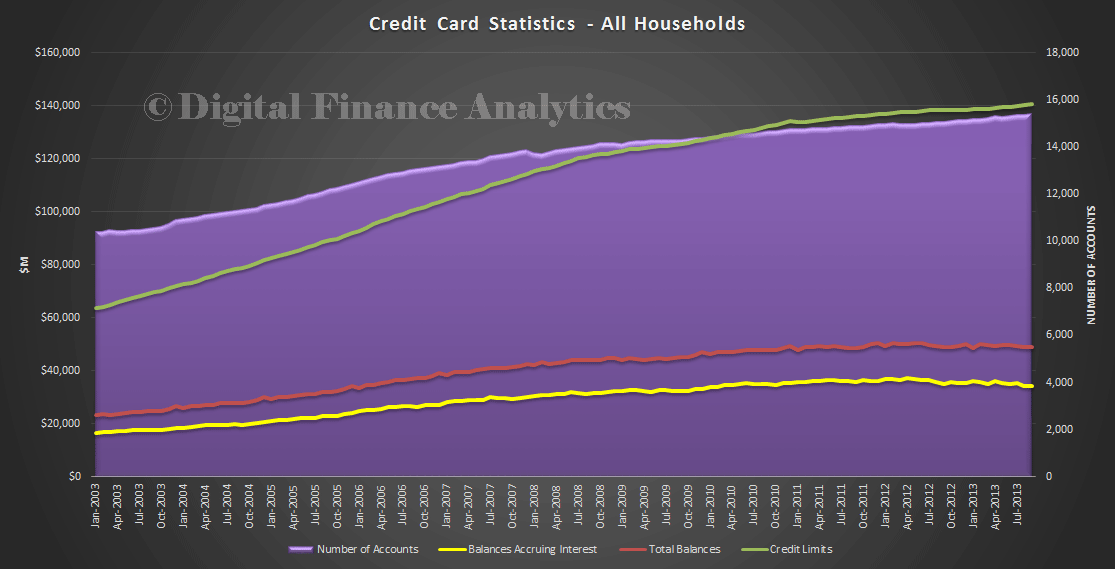
Each month the Reserve Bank publishes Credit Card data as part of its statistical tables. DFA incorporates this data into the market models we maintain, and we use a cards specific segmentation to analyse it. But this time, we also overlaid our property household segmentation to draw additional insights with this lens. So today I will summarise our findings using this perspective. Overall, the data shows growth in the number of accounts issued (the blue area), growth in limits being offered, but a decline in both overall balances and revolving balances. So, other than the banks continuing to offer product, not much to see. Indeed, on average households appear to be paying off debt. However, segmented analysis brings out interesting and concerning detail.
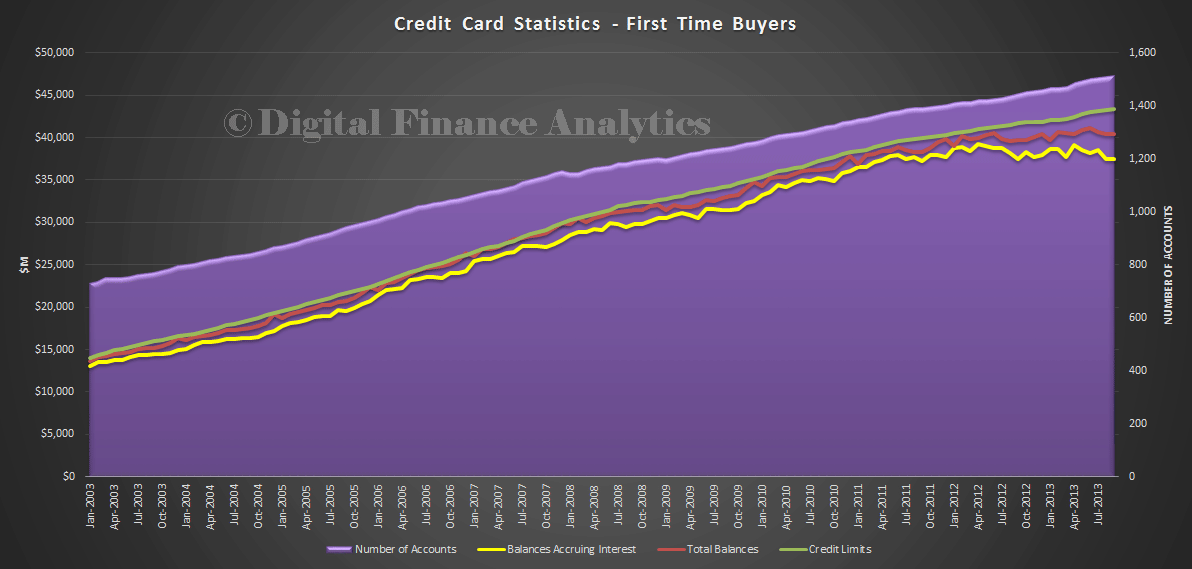
First we look at the first time buyers, those who entered the market, or have plans in train to do so. We find that they are accumulating more credit card accounts and credit limits, and that most of the balances on the cards are revolving. Compared with the average, they are more in debt. Our survey also shows they tend to source their cards across multiple providers, and also use store credit. They are managing their multiple debts close to the card limits. This may be fine, so long as unemployment does not hit.
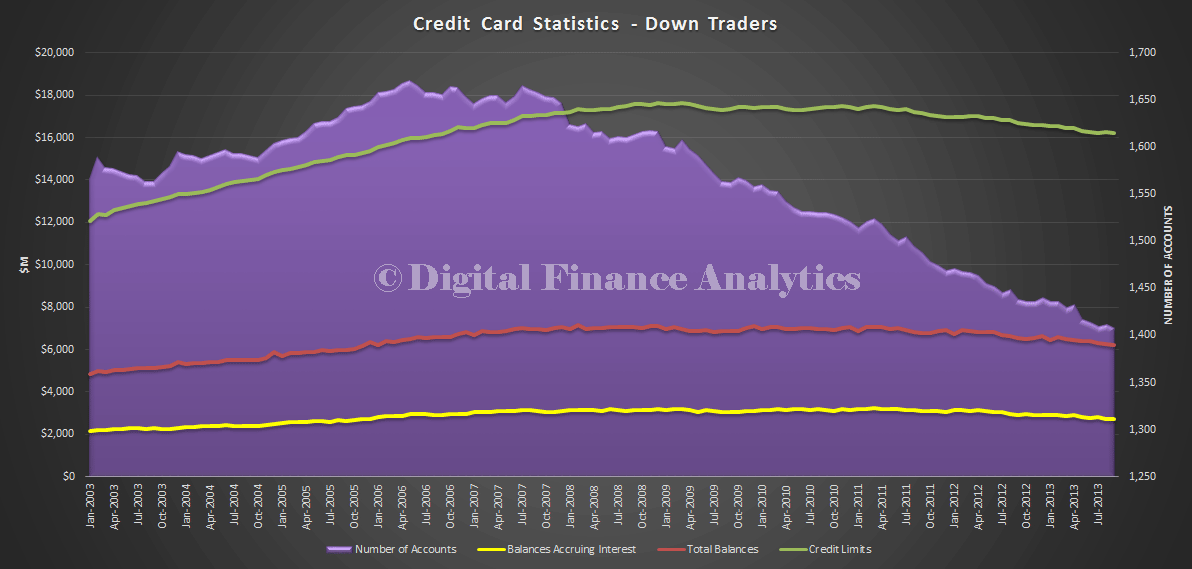
Now, compare this with the down traders, those older households looking to move to a smaller property and release equity for savings or investment. A different story, with the number of card accounts and credit limits falling, lower revolving balances, and lower balances overall.
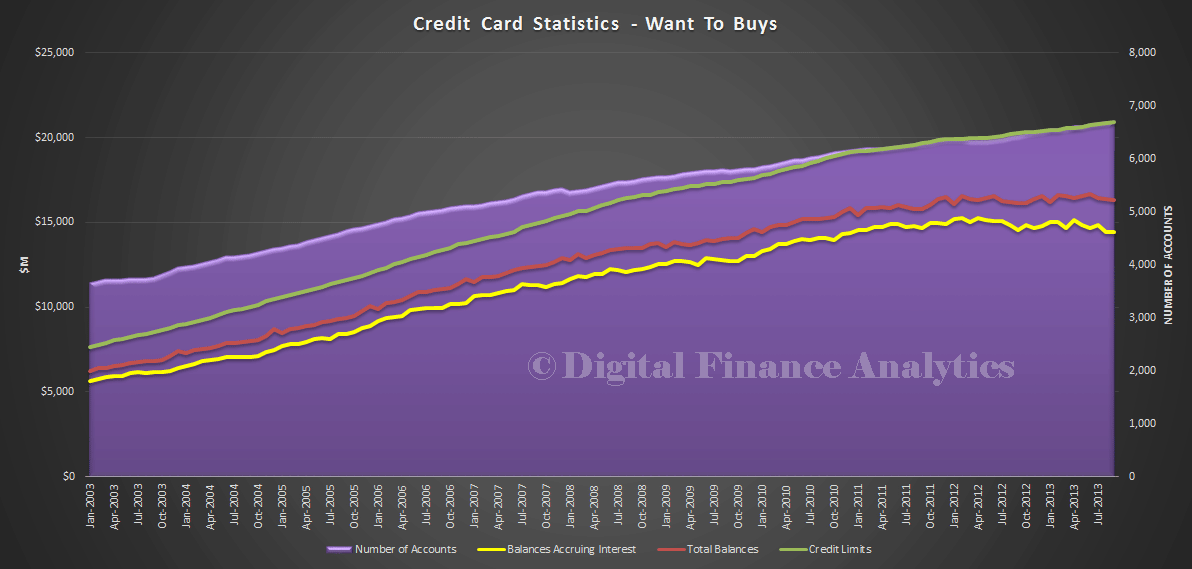
The want to buys (those not in the property market because they are priced out), show characteristics closer to first time buyers, but not so extreme. However, I note that card accounts and limits are growing in this cohort, and they are utilising revolving credit, though well within their limits. Our survey revealed that existing debt (like cards) was one of the barriers to them entering the property market.
I won’t display data for all the other segments, but suffice to say, there are significant variations in behaviour, card use, revolving credit balances and even number of accounts. So the final chart addresses the average number of card accounts per household, by type. (There may be multiple cards on one account of course).
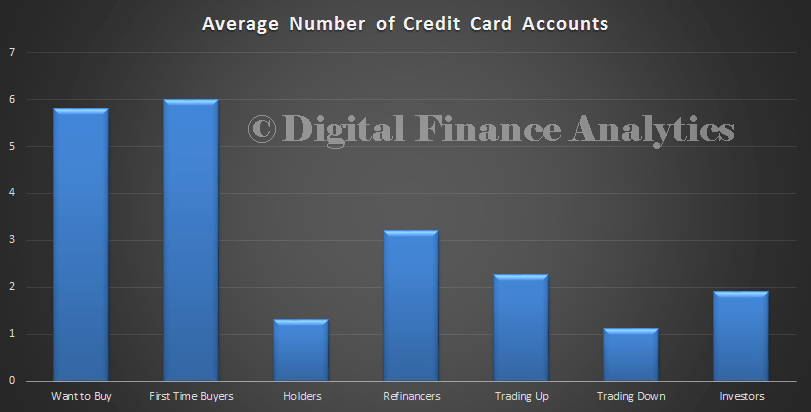
There is an interesting inter-generational issue here, with younger property aspirants or purchasers holding more cards (perhaps with lower limits?) than older households, who are using their cards quite differently. We know that overall household debt remains high, and the credit card portfolio is an important factor in this. The fact that overall card debt is falling appears to mask the greater concentration amongst more vulnerable households. Remembering that yesterday we showed households are more in debt for longer now, this additional data helps paint the more complete, segmented, picture.
