Regular readers will recall that I’ve launched something of armchair jihad against Westpac’s busted Leading Index which, frankly, was spoiling otherwise market leading output at the institutional bank. Today the index is relaunched with a new methodology and given the MSM have breathlessly reported the ragged old thing regardless of its merits, maybe, just maybe, I’ve had some effect!
Anyways, here is the new bastard:
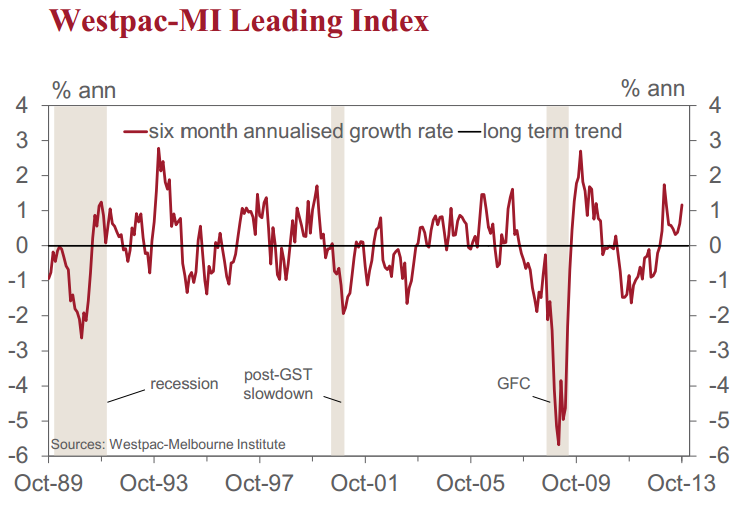
The growth rate in the Leading Index has been above trend for the last 12 months. That followed an 18 month period where growth was below trend and was clearly signalling the soft growth which the economy experienced in the year to the June quarter where GDP growth registered a disappointing 2.6%. Recent above trend growth in the Index is pointing to a much better outcome over the next few quarters.
Readers will be aware that the Index which is reported in today’s release has been significantly restructured following an exhaustive review which was conducted in 2012 and 2013. The new Index includes only monthly series which are not subject to the material revision which the quarterly series in the original Index experienced. Furthermore, the components of the Index are available on a more timely basis, allowing us to report the Index with only a one month lag rather than the two months for the original Index. Our exhaustive historical analysis of both Indices indicates that the new Index is likely to detect turning points in the cycle earlier than the original Index. A detailed analysis of the new Index and comparison with the performance of the original
Index was released on November 19 and is attached to this press release.
Westpac is expecting growth over the year to June 2014 of 2.2% while the Reserve Bank recently released its own growth forecasts to June at 2.5%.These forecasts take into account an unusually significant drag from the downturn in mining investment. It is not clear how this large individual factor can be captured in the Leading Index. As such we should interpret the signal from the Leading Index as pointing to a solid lift in the growth momentum of the non mining sector. That is a significant observation and one that will give the authorities some encouragement that their plans to rebalance growth to accommodate the slowdown in mining are paying dividends.
Close followers of the original Leading Index should be interested by our choice of components for the new Index.
The components of the new Leading Index are: ASX200; Westpac-MI CSI Expectations index; US industrial production; RBA Commodity price index (AUD terms); dwelling approvals; yield spread (10 year bond rate – 90 bank bill rate); Westpac-MI Unemployment expectations index; and aggregate monthly hours worked. All these series are monthly.
The components of the previous index were: All ordinaries index; real money supply; dwelling approvals; United States industrial production; manufacturing materials prices (quarterly); overtime worked (quarterly); productivity (quarterly); real corporate gross operating surplus (quarterly).
As with our analysis of the original Index we disaggregate the main components’ contribution to the change in its growth rate over the last 6 months. Over the last 6 months the 6 month annualised deviation from trend growth pace of the Index lifted from 0.58% to 1.16%. Positive contributions to that change came from: dwelling approvals (0.24 ppt’s); the yield spread (0.26 ppt’s); Westpac–MI Consumer Sentiment Expectations Index (0.11 ppt’s); Westpac–MI Unemployment Expectations Index (0.09 ppt’s); US industrial production (0.06 ppt’s) and aggregate hours worked (0.06 ppt’s). The ASX 200 (–0.13 ppt’s) and the RBA Commodity AUD Price Index (–0.11 ppt’s) both detracted from the growth rate.
Over the month the level of the Index increased from 98.5 to 98.6. Four components of the Index increased while three fell. The ASX 200 rose by 3.9%, dwelling approvals increased by 13.4%, aggregate monthly hours worked rose by 0.4% and the Westpac–MI expectations Index rose by 0.9% (a negative impact on the level of the Index). The Westpac MI expectations Index fell by 2.4%; US industrial production fell by 0.1% and commodity prices fell by 2.4%.
The yield spread was roughly unchanged in October. The Reserve Bank board next meets on December 3. As indicated in the minutes from the November meeting the board retains its easing bias but is unlikely to act on that bias in December. The components of the leading index highlight the bank’s current challenge. Strong results in the housing market are providing a fillip to the economy but, at this stage prospects for the labour market and world economy are uncertain. The board will need more time to assess how these various forces impact the growth outlook.
It is our view that there is scope now for lower rates and as we progress through 2014 the need will become progressively more apparent to the Bank that rates can come down further.
Definitely an improved composition. But I would have added a capex component, not just to capture the next few years of trouble, business investment is always a leading indicator for growth. If you wanted a monthly one then I’d use the NAB’s business survey.
David Llewellyn-Smith is Chief Strategist at the MB Fund and MB Super. David is the founding publisher and editor of MacroBusiness and was the founding publisher and global economy editor of The Diplomat, the Asia Pacific’s leading geo-politics and economics portal.
He is also a former gold trader and economic commentator at The Sydney Morning Herald, The Age, the ABC and Business Spectator. He is the co-author of The Great Crash of 2008 with Ross Garnaut and was the editor of the second Garnaut Climate Change Review.