From SQM Research’s weekly newsletter comes news that it has launched a new index measuring implied gross rental yields.
According to Louis Christoper:
This index is a measurement of gross rental yields. That is – rents before costs such as agent fees, council fees, maintenance, taxes etc divided into the median sale price for the locality. When you notice rental yields moving lower, it is a sign that either dwelling prices are rising faster than rents or that rents are falling to compared to dwelling prices. In other words, the gap between house prices and rents has increased. Vice versa, when rental yields are rising, it means the gap between house prices and rents is narrowing.
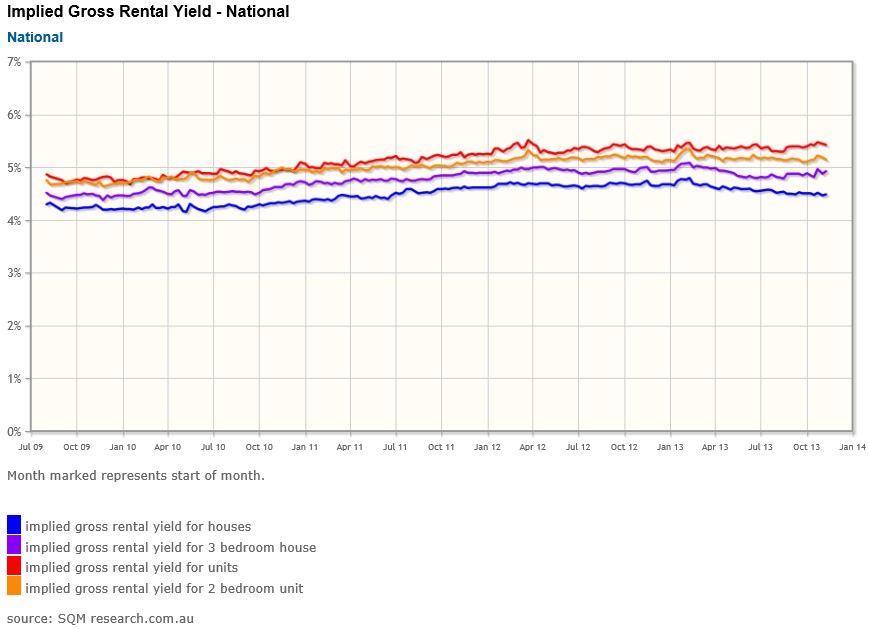
So what do the yields show? Well, at the national level the data reveals that gross rental yields for houses at about 4.5% while for units it is 5.5%.
There has been a moderate decline in yields for houses over the course of this year, however unit rental yields have remained stable.
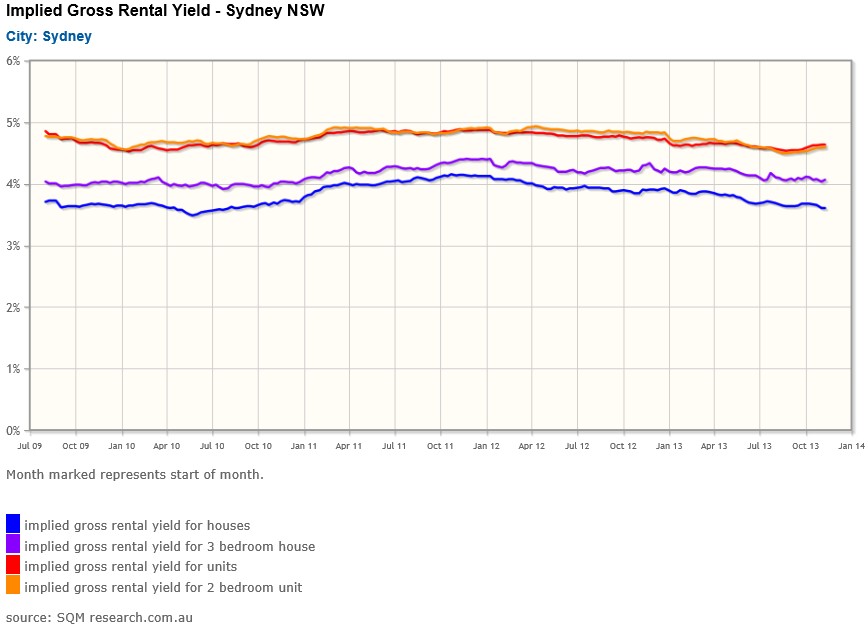
Sydney has been recording steadily declining rental yields over the course of the year and that is obviously due to the rapid rise in dwelling prices in recent times. So rental yields for houses is about 3.7%, while for Sydney units it is about 4.5%. They are actually very tight yields and would suggest to us that in Sydney at least, its cheaper to rent right now than to buy when just considering year one cash flows.
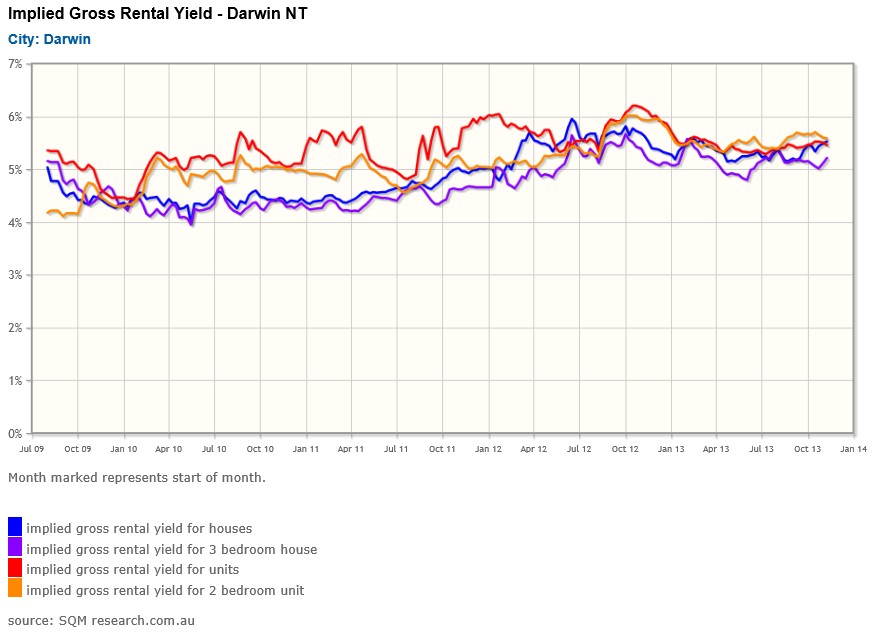
Darwin, meanwhile has the highest capital city yields with both houses and units recording a 5.5% gross rental yield. Yields in Darwin may well rise in the future as right now we are recording rising rents for that city, while it seems dwelling prices have stalled of late.
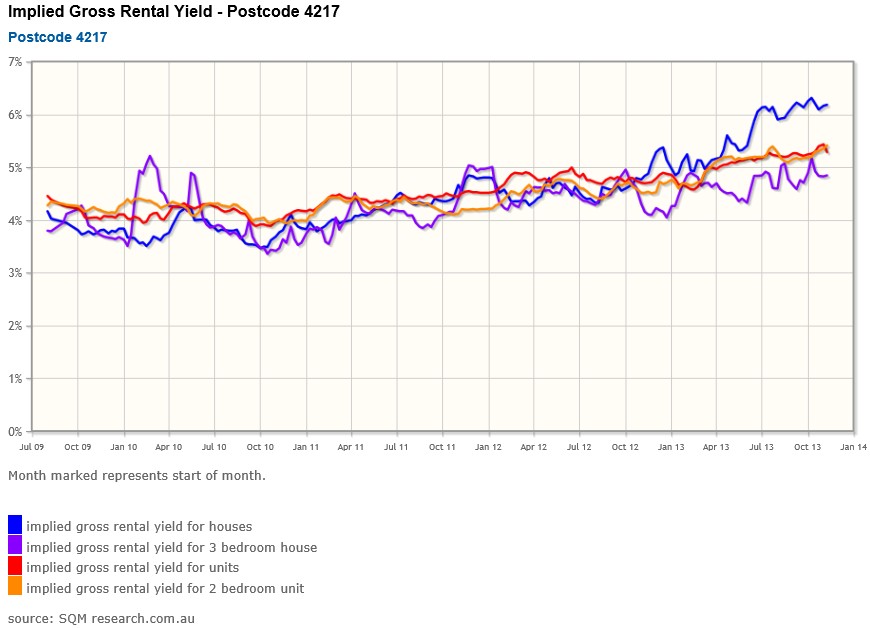
On a postcode level, we have discovered some particularly interesting results – for example postcode 4217 (Surfers Paradise in Queensland):
Overall, it is a relatively young series we have released today. The index only goes back to 2009, so in effect it have only captured one cycle in the housing market. But nevertheless it does give us all an indicator of market movement and value.
Leith van Onselen is Chief Economist at the MB Fund and MB Super. He is also a co-founder of MacroBusiness.
Leith has previously worked at the Australian Treasury, Victorian Treasury and Goldman Sachs.