The Australian Bureau of Statistics (ABS) has today released an interesting report examining the growth in mortgage repayments between the 2006 and 2011 census periods, whereby median repayments grew at nearly twice the rate of incomes:
Between 2006 and 2011, median monthly mortgage repayments in Australia climbed 38.5 per cent, from $1,300 to $1,800…
ABS Director of Rural and Regional Statistics Lisa Conolly said “Between 2006 and 2011 mortgage costs increased more than wages; the median weekly household income increased by 20.2 per cent, compared to an increase of 38.5 per cent in mortgage repayments”.
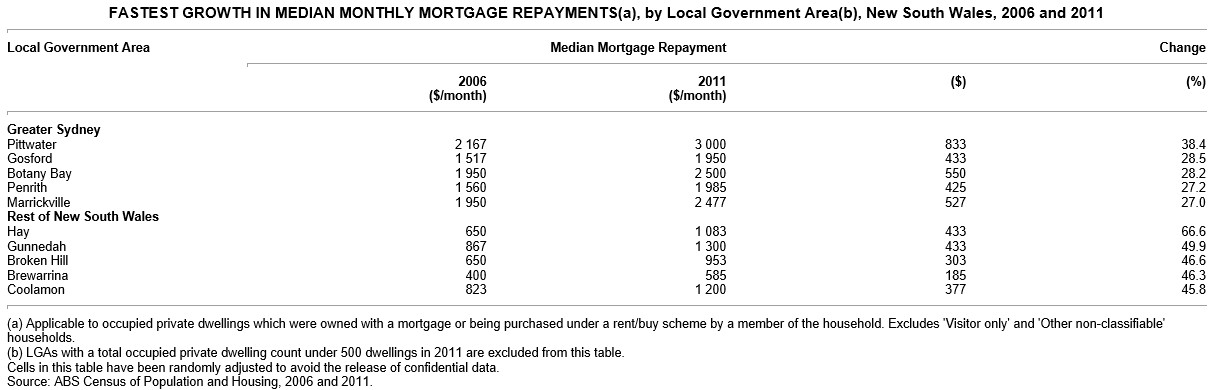
The most expensive mortgage repayment of all Local Government Areas (LGA) in Australia in 2011 was Woollahra, in Sydney’s eastern suburbs, with a median monthly mortgage repayment of $3,250, compared to the rest of New South Wales at $1,933.
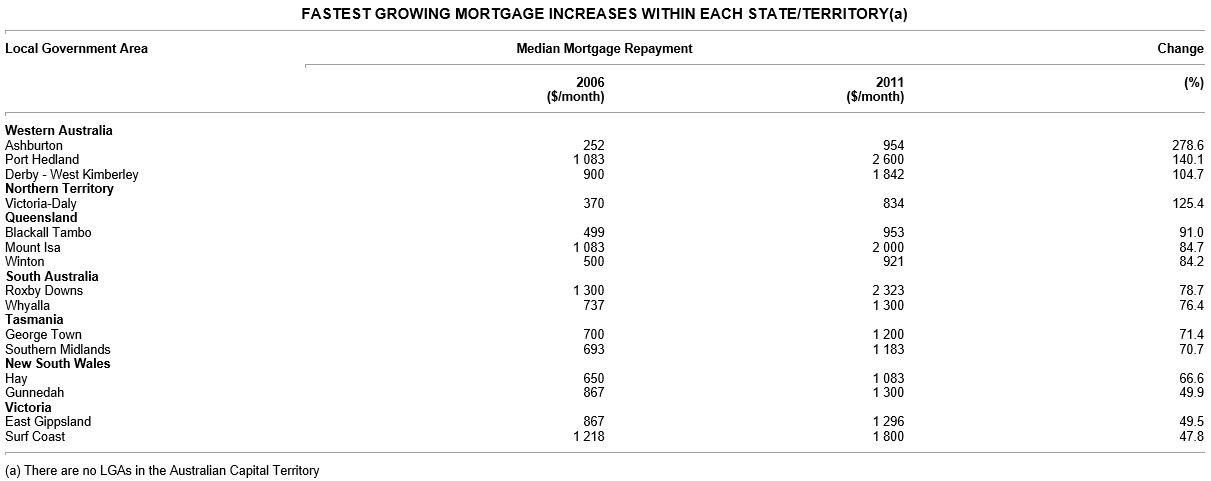
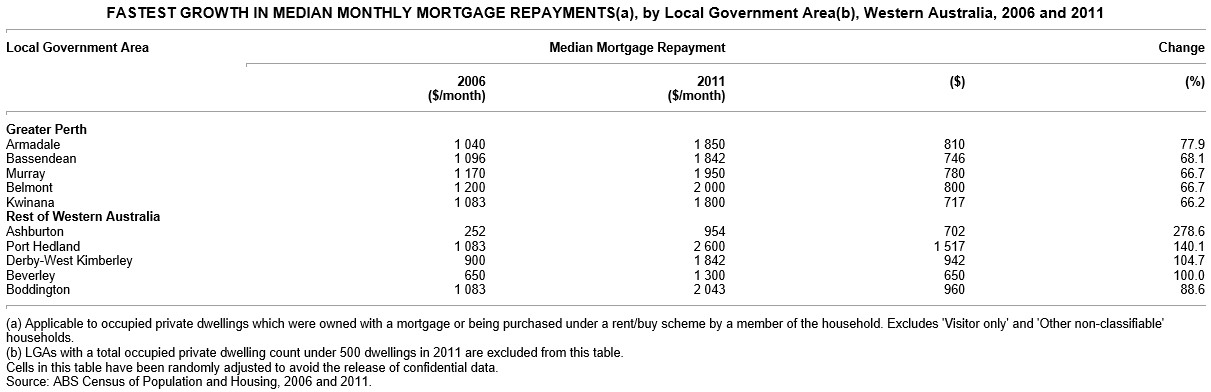
The fastest increase in a median monthly mortgage repayment was recorded in Ashburton in Western Australia which increased by 278.6 per cent compared to 2006.
Analysing the growth in median mortgage repayments in regions is complex. There are a range of factors that influence how mortgage costs in regions change, including local economic circumstances, regional housing supply and demand, the age of the mortgages and stage of life of the local population.
“Regions, such as Ashburton and Port Hedland in Western Australia, have experienced high population growth and turnover, meaning that there would be increased demand for housing in these regions, and possibly new home owners with new mortgages,” said Ms Conolly.
Housing costs are the largest regular expense for many Australians, and this article looks at how mortgage repayments vary in regions across Australia, and how these costs changed between 2006 and 2011.
The fastest growing mortgage costs were seen in LGAs outside the capital cities.
Obviously, with only tepid house price growth recorded in the two years since 2011, and mortgage rates having fallen by around 2%, the disparity between mortgage repayments and incomes would have since narrowed.
Advertisement
Nevertheless, below is a summary of how each state/territory fared over the five year period.
New South Wales and the ACT:
– In 2011, the proportion of homes owned with a mortgage in New South Wales was 33.4% and in the Australian Capital Territory 38.9%, compared with 34.9% for Australia.
– The Local Government Area (LGA) with the highest proportion of homes owned with a mortgage in New South Wales was Camden with 52.7%. Other LGAs with proportions of 45% or more were Wollondilly (49.6%), the Hills Shire (46.4%), and Palerang (45.8%).
– In the inner city LGA of Sydney, 23.2% of homes were owned with a mortgage by the residents on Census Night.
– The median monthly mortgage repayment in the Australian Capital Territory increased by 44.5% to $2,167 in 2011 from $1,500 in 2006.
Victoria:
Advertisement
– In 2011, the proportion of homes owned with a mortgage in Victoria was 35.9%, compared with 34.9% for Australia.
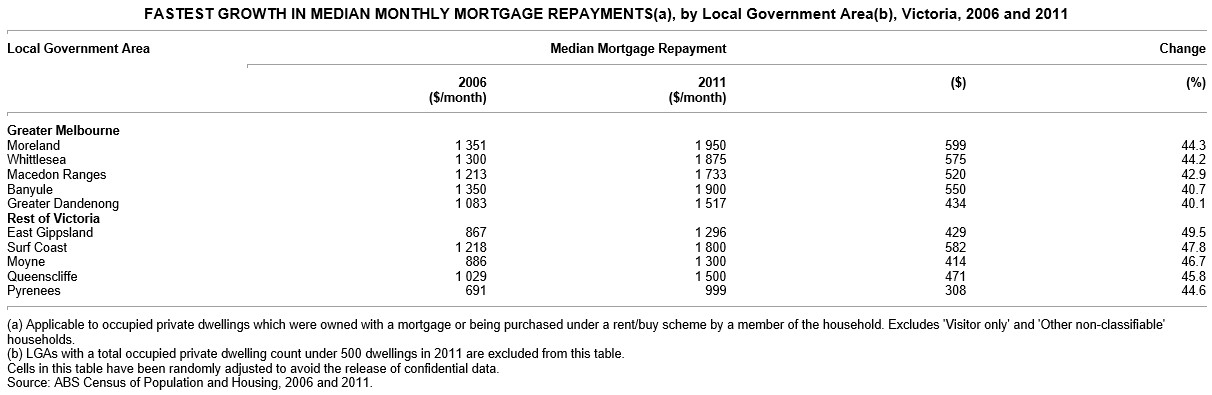
– LGAs with high proportions of homes owned with a mortgage were located in the outer areas and on the fringe of Melbourne.
– The LGAs with the fastest growth in mortgage costs in Greater Melbourne were Moreland (44.3%) and Whittlesea (44.2%), located in the north of the city.
Queensland:
– In 2011, the proportion of homes owned with a mortgage in Queensland was 34.5%, compared with 34.9% for Australia.
– Queensland had three Local Government Areas (LGA) with proportions of homes owned with a mortgage of 40% or more; Logan (42.8%), Redland (40.5%), and Gladstone (40.0%). Logan and Redland are located in the east of the state, near Brisbane. Gladstone is located north of Brisbane along the coast.
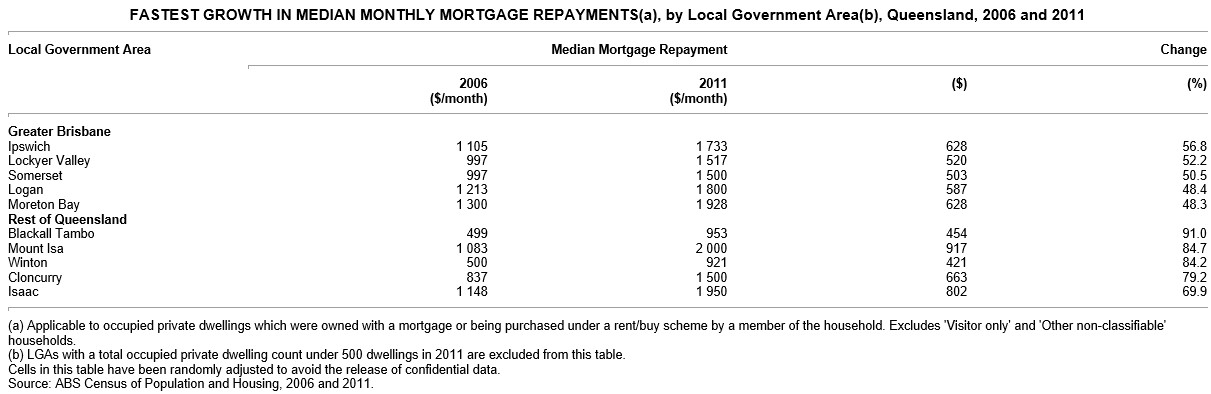
– The fastest growth in median monthly mortgage repayments in Greater Brisbane was in the LGA of Ipswich, with an increase of 56.8%.
– The LGAs with the fastest growth in mortgage costs in Greater Brisbane were mainly located in the western and northern areas of Brisbane.
– The LGAs with the fastest growth in mortgage costs in the rest of Queensland were mainly located in inland regions in the western and northern parts of the state. Many of these areas have mining as a main industry, such as Mount Isa and Isaac.
Western Australia:
– In 2011, the proportion of homes owned with a mortgage in Western Australia was 37.8%, compared with 34.9% for Australia.
– LGAs with high proportions of homes owned with a mortgage were located on the fringe or outer areas of the major cities of Perth and Bunbury
– Between 2006 and 2011, the LGA with the fastest growth in median monthly mortgage repayments in Australia was Ashburton, which encompasses Onslow, in the north west of Western Australia, with an increase of 278.6%.
– The LGA with the fastest growth in median monthly mortgage repayments between 2006 and 2011 in Greater Perth was Armadale, which rose by 77.9%.
– The LGAs with the fastest growth in mortgage costs in Greater Perth were mainly located in the south and east of the city.
South Australia:
Advertisement
– In 2011, the proportion of homes owned with a mortgage in South Australia was 35.3%, compared with 34.9% for Australia.
– The LGAs with high proportions of homes owned with a mortgage were located on the fringe or outer areas of the major cities of Adelaide and Mount Gambier.
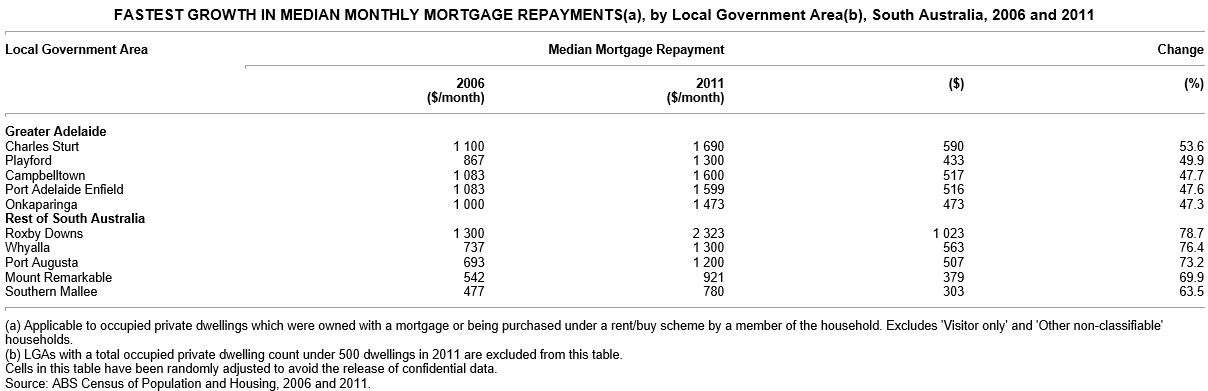
– In South Australia, the LGA with the fastest growth in median monthly mortgage repayments between 2006 and 2011 was Roxby Downs in the far north of the state, with an increase of 78.7%.
– The LGA with the fastest growth in mortgage costs in Greater Adelaide was Charles Sturt, in the west of the city, which rose by 53.6%.
Tasmania:
– In 2011, the proportion of homes owned with a mortgage in Tasmania was 34.2%, compared with 34.9% for Australia.
– In more than half of Tasmanian LGAs (18 out of 29) the proportion of homes owned with a mortgage was between 30 and 40%.
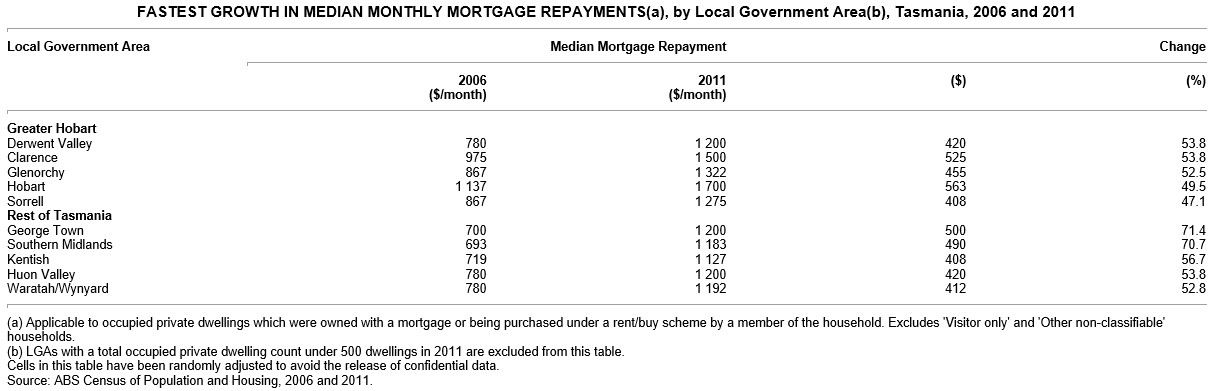
– The LGAs with the fastest growth in mortgage costs in Greater Hobart were Derwent Valley, in the south, and Clarence, in the east, both with 53.8%.
– The LGAs with the fastest growth in mortgage costs in the rest of Tasmania were mainly located in the north and north west of the state, particularly around Devonport and Launceston.
Northern Territory:
– In 2011, 30.6% of homes were owned with a mortgage in the Northern Territory, compared with 34.9% for Australia.
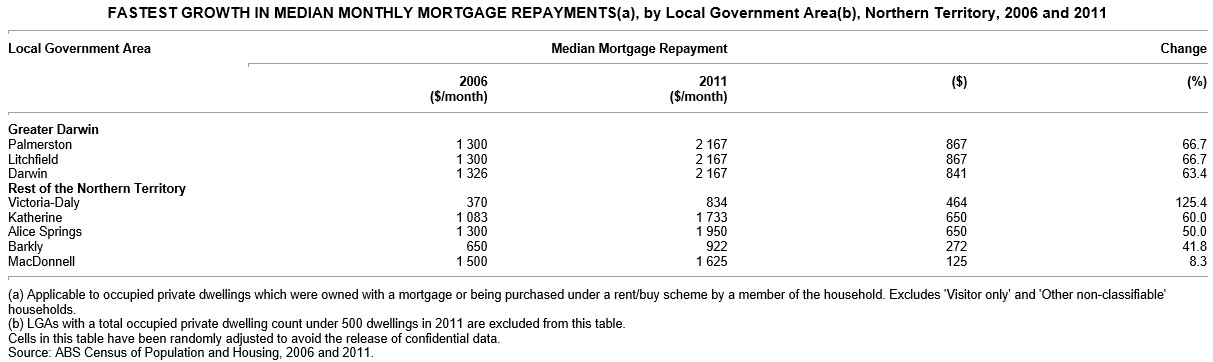
– In the Northern Territory, the LGA with the fastest growth in median monthly mortgage repayments between 2006 and 2011 was Victoria-Daly (125.4%), located in the north-west of the territory.
– The LGAs in Greater Darwin with the fastest growth in mortgage costs were Palmerston and Litchfield, both with 66.7%.
Leith van Onselen is Chief Economist at the MB Fund and MB Super. He is also a co-founder of MacroBusiness.
Leith has previously worked at the Australian Treasury, Victorian Treasury and Goldman Sachs.