
The daily proposition that is the taper diminished Friday as US data came in universally weak and risk was “awn”. The line-up included industrial production for October sliding:
Industrial production edged down 0.1 percent in October after having increased 0.7 percent in September. Manufacturing production rose 0.3 percent in October for its third consecutive monthly gain. The index for mining fell 1.6 percent after having risen for six consecutive months, and the output of utilities dropped 1.1 percent after having jumped 4.5 percent in September. The level of the index for total industrial production in October was equal to its 2007 average and was 3.2 percent above its year-earlier level. Capacity utilization for the industrial sector declined 0.2 percentage point in October to 78.1 percent, a rate 1.1 percentage points above its level of a year earlier and 2.1 percentage points below its long-run (1972-2012) average.
Capacity utilisation dropping sharply too won’t help the Fed find inflation. As well, the NY Empire State manufacturing index fell in November:
The November 2013 Empire State Manufacturing Survey indicates that manufacturing conditions weakened somewhat for New York manufacturers. The general business conditions index fell four points to -2.2, its first negative reading since May. The new orders index also entered negative territory, falling thirteen points to -5.5.
The prices received index fell to -4.0; the negative reading was a sign that selling prices had declined—their first retreat in two years. Labor market conditions were also weak, with the index for number of employees falling four points to 0.0, while the average workweek index dropped to -5.3. Despite the negative readings registered by many of the indexes for current activity, indexes for the six-month outlook continued to convey a strong degree of optimism about future business conditions.
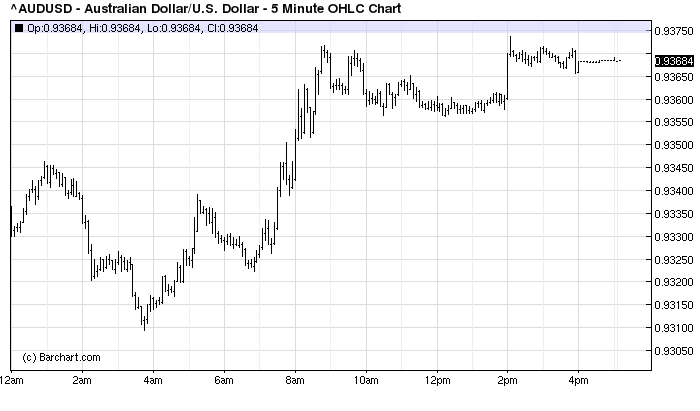
That was enough to send stocks to new record highs. Bonds were flat. Gold and the Us dollar were essentially flat but the Aussie got half a cent bounce, no doubt helped along by a positive market reaction to China’s reform detail:
This week the key releases are all housing related and it will give us more to go on viz. the effects of rising mortgage rates. On that front, Calculated Risk is wary:
Based on local realtor/MLS reports across the country, I estimate that existing home sales as measured by the National Association of Realtors ran at a seasonally adjusted annual rate of about 5.08 million in October, down 4.0% from September’s seasonally adjusted pace. It’s difficult to gauge the extent to which last month’s government shutdown impacted closings last month, but weakness in contract signings prior to the shutdown suggest that last month’s decline in closings was mainly the result of higher mortgage rates and higher home prices. Weakness in closings was not uniform across the country – many Northeast markets, e.g., saw stronger YOY sales growth – but outside of the Northeast most markets saw a sales slowdown.
On the inventory front, most markets saw a “typical” seasonal decline in listings, but a number of markets actually saw an increase in listings – including many markets where the investor share of home sales has been higher than the norm over the last few years. Based on realtor/MLS reports AND on entities that track listings, I estimate that the inventory of existing homes for sale as measured by the NAR declined by 1.4% from the end of September to the end of October, which would imply that October listings would be up 3.3% from last October.
On the question of how high, how quickly for interest rates, here is a chart of the 30 year bond yield with QE dates marked:
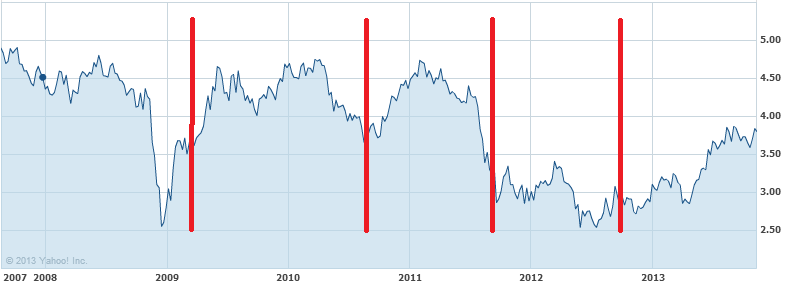
As you can see, QE episodes actually tend to mark the bottom of yields, the one exception being QE2.5, Operation Twist, which very deliberately targeted long bonds.
This may seem counter-intuitive but if you accept that markets generally operate on Monetarist principles it makes sense. Bonds are moving quickly from expecting easing to expecting inflation. They should be reading more Irving Fisher. There is also some “buy the rumour, sell the fact” action going on.
Without getting too technical about it I reckon it’s pretty clear that if tapering begins then 30 year yields are going to rise towards 4.5%, another three rate hikes or so. And it will happen fast.
Is the US economy up to that? Existing and new housing will slow a lot more and the odds have to be that tapering tapers itself. Later and less will be the Fed’s credo!
