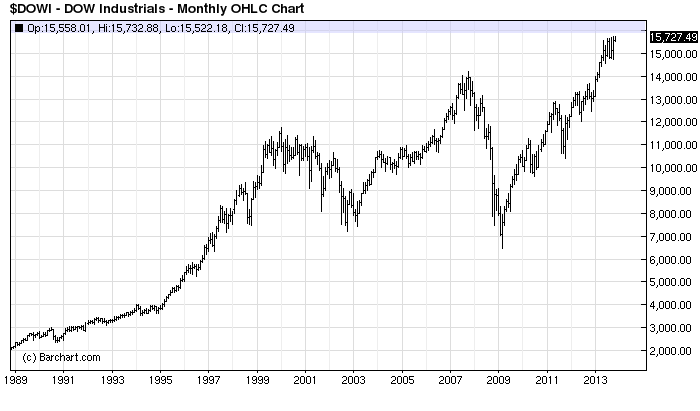
The S&P500 fell short of another record last night but the Dow didn’t miss out, narrowly scoring a new record high:
The causes were twofold. First, the likelihood of an ECB rate cut faded and the US dollar fell a little as result. More to the point, last night’s ongoing QE quandry resolved in favour of more spondooly!
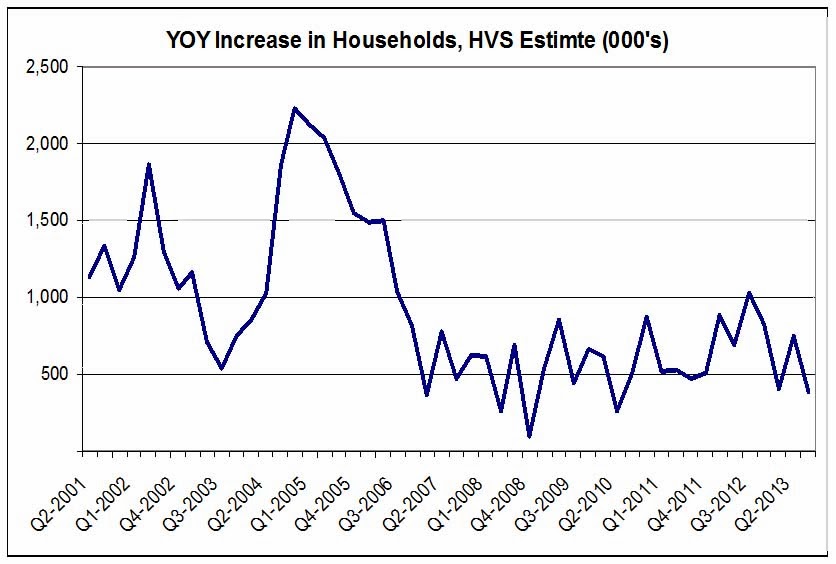
First up, the US Census released new household formation data and it was a real fizzer. From Calculated Risk:
Advertisement
The surprising – and if true, disturbing – stat from the report is the estimate for occupied homes, which for last quarter was up just 380,000 from a year ago. That YOY increase is the lowest since the second quarter of 2010, and such anemic growth, if accurate, would be “most disturbing” from a “housing recovery” perspective. However, other estimates from a CPS-based survey earlier this year show significantly faster household growth from early 2012 to early 2013 than does the HVS, making it difficult to determine what, if anything, this latest report might mean.
It means housing doubts. There were more of those from the weekly Mortgage Banker’s Association data which hit new lows for refi and new purchases:
Mortgage applications decreased 7.0 percent from one week earlier, according to data from the Mortgage Bankers Association’s (MBA) Weekly Mortgage Applications Survey for the week ending November 1, 2013. …The Refinance Index decreased 8 percent from the previous week. The seasonally adjusted Purchase Index decreased 5 percent from one week earlier and is at its lowest level since the end of December 2012. ……The average contract interest rate for 30-year fixed-rate mortgages with conforming loan balances ($417,000 or less) decreased to 4.32 percent from 4.33 percent, with points increasing to 0.42 from 0.26 (including the origination fee) for 80 percent loan-to-value ratio (LTV) loans.
Advertisement
But QE forever did not have it all it’s own way. As noted many times, the Fed is only interested in the taper at all because it sees possible asset bubbles forming. Fitch confirmed that for US housing:
As a whole, the signs of a strengthening economic recovery are present, with momentum continuing to trend in a positive direction. Fitch expects these trends to continue, although the high rate of home price growth is not considered to be sustainable. Currently, Fitch’s Sustainable Home Price Model estimates national prices to be approximately 17% overvalued in real terms, with individual geographic regions varying widely.
Based on the historic relationship between home price levels and the primary drivers of supply and demand in the market, there is a misalignment. A continuing recovery and exuberant home-buying population could well push prices further for many more quarters, or even years. However, Fitch identifies a bubble risk in continuing price rises and sees several factors which could halt or even reverse recent gains in the market.
The NRI, which measures the relative default risk of a constant quality loan as compared to average originations of the 1990s, has risen in two consecutive quarters, showing a rise for the first time since 2007.
Currently at 1.14, the NRI implies that the default risk of a loan originated today is 14% higher than the 1990s average. Since the peak in early 2007, risk has been declining for newly originated loans as the bubble unwound and prices reverted towards historic averages. On the back of the abrupt price rises across the country and interest rate rises which are expected to limit prepayment speeds for the next several years, the NRI has now increased.
…Most concerning, there is growing evidence that recent gains have been bolstered by an increase in investment sales, both to institutions and local investors.
Cash sales are often indicative of investor behavior and the concern is that housing prices are being driven up more through speculative buying than from an increasing base demand.
Typically, bubble cycles form when an initial catalyst causes prices to rise and the increase in prices drives investment activity to the market, hoping to cash in on the rising prices. As investment activity increases, demand builds artificially, reflecting a level of demand that fluctuates drastically with the growth rate of prices instead of long-term demand based on housing necessity.
Better read that, RBA!
Advertisement
But the most important development of the night came from the Fed itself. From CNBC:
Under current Fed thinking, the unemployment rate would have to drop to just 6.5 percent—with the inflation rate rising to 2.5 percent—before making changes in the present structure, which has the policy target rate near zero.
But the research from a half-dozen Fed economists maintains the unemployment objective actually should be lowered to 6.0 percent or even 5.5 percent before it makes any moves.
It is hard to overstate the importance of two new Fed staff studies that will be presented at the IMF’s annual research conference on November 7-8. The lead author for the first study is William English, who is the director of the Monetary Affairs division and the Secretary and Economist of the FOMC. The lead author for the second study is David Wilcox, who is the director of the Research and Statistics division and the Economist of the FOMC. The fact that the two most senior Board staffers in the areas of monetary policy analysis and domestic macroeconomics have simultaneously published detailed research papers on central issues of the economic and monetary policy outlook is highly unusual and noteworthy in its own right. But the content and implications of these papers are even more striking.
…[O]ur initial assessment is that they considerably increase the probability that the FOMC will reduce its 6.5% unemployment threshold for the first hike in the federal funds rate, either coincident with the first tapering of its QE program or before.
…
[O]ur central case is now that the FOMC will reduce the threshold from 6.5% to 6% at the March 2014 FOMC meeting, alongside the first tapering of QE; however, a move as early as the December 2013 meeting is possible, and if so, this might also increase the probability of an earlier tapering of QE.
Ah, the old girl is learning. When you’ve blown an historic bond bubble it’s not so easy to exit without an explosion in rates. Unless you link tapering of asset purchases with new promises to never actually lift interest rates again! That’s enough to keep the market drinking heavily. It’s the taper you’re having when you’re not having a taper.
David Llewellyn-Smith is Chief Strategist at the MB Fund and MB Super. David is the founding publisher and editor of MacroBusiness and was the founding publisher and global economy editor of The Diplomat, the Asia Pacific’s leading geo-politics and economics portal.
He is also a former gold trader and economic commentator at The Sydney Morning Herald, The Age, the ABC and Business Spectator. He is the co-author of The Great Crash of 2008 with Ross Garnaut and was the editor of the second Garnaut Climate Change Review.