
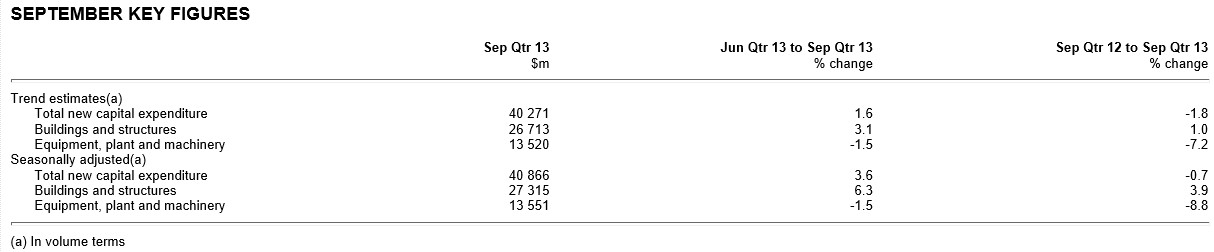
The Australian Bureau of Statistics (ABS) today released data on capital expenditures (capex) for the September quarter of 2013, which registered a seasonally-adjusted 3.6% rise in capex over the quarter but a 0.7% decline over the year. The result exceeded analyst’s expectations of a 1.2% fall over the quarter (see below table).
While Houses and Holes will cover the more important capex intentions survey, which covers industry’s forward-looking capex plans over the coming years, below are some backward looking charts showing actual capex up to the September quarter of 2013.
The first chart below shows actual capex by industry in dollar terms (rather than volume terms as shown above). As you can see, the rise in total capex (4.6%) was broad-based, with mining capex (+4.9%), manufacturing capex (+4.7%), and other capex (+4.0%) all rising (see next chart).

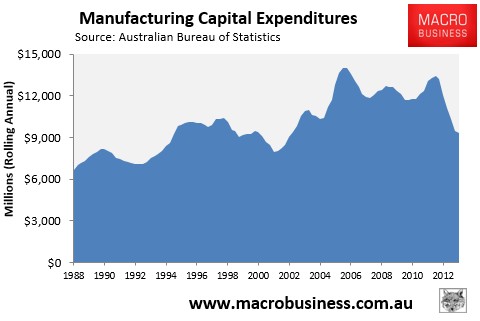
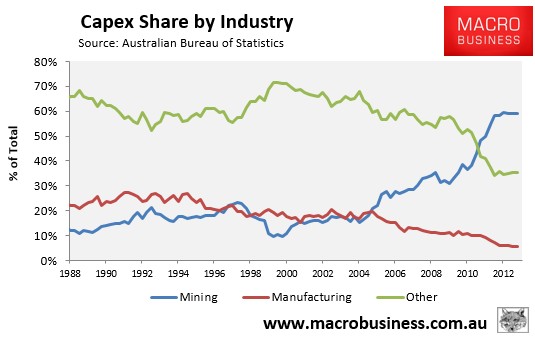
While the overall news is good, with the capex cliff averted for the time being at least, manufacturing capex remains in the doldrums, despite this quarter’s rise. Manufacturing capex is now only marginally above the decade low set last quarter in nominal terms, with its share of total capex steady at just 5.5% (see below charts).
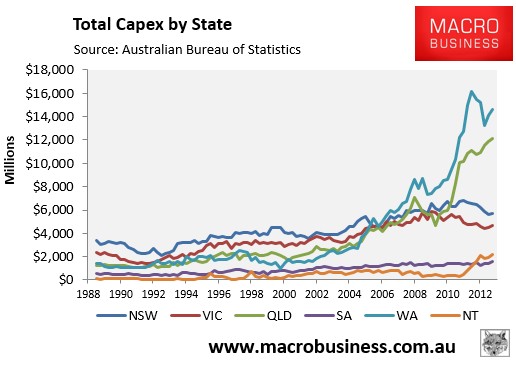
The rise in overall capex was broad-based across Australia, with all jurisdictions registering increases. In dollar terms, Capex rose most strongly in Western Australia (+$516 million), followed by the Northern Territory (+255 million) and then Victoria (+229 million):
Looking ahead, the capex pipeline continues to trend lower, due to falling planned mining investment (see next chart).
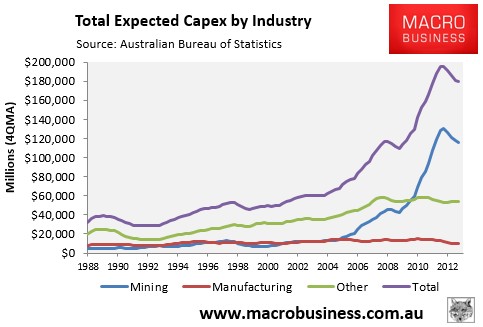
Overall, this release augers well for the upcoming GDP print, with the second consecutive rise in capex after three quarters of falls signalling more of a plateau than a cliff. That said, the longer-term outlook hasn’t changed all that much. Mining capex is still facing a prolonged period of falls, although the timing and magnitude is obviously uncertain.
unconventionaleconomist@hotmail.com
