
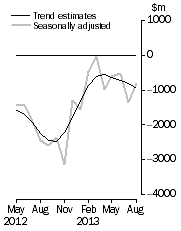
In our second miss for the morning, ABS’s International Trade in Goods and Services also went wide of consensus with the dart throwers getting double the hoped for $400 million deficit. Most of the miss appears to have been generated by an unexpected surge in consumption goods. Perhaps some restocking in expectation of a lift in spirits post election?
Australia’s trade balance improved in August but from a weaker starting position, following revisions to July.
The deficit shrank on the month so may add to growth a little but we have now established a new downtrend in trade deficits. July was revised down to a $1,375mn deficit in July, revised from an originally reported deficit of $765mn.
Imports increased by 0.9% in the month.
Exports were up 3.1%. Strength was concentrated in metal ores +$538mn (7.4%) and gold, +$307mn (33%).
AUGUST KEY FIGURES
 | |
Jun 2013 |
Jul 2013 |
Aug 2013 |
Jul 13 to Aug 13 |
| |
$m |
$m |
$m |
% change |
| BALANCE ON GOODS AND SERVICES | | | | | |
| Trend estimates |
–737 |
–824 |
–952 |
–16 |
| Seasonally adjusted |
–515 |
–1 375 |
–815 |
41 |
| CREDITS (Exports of goods and services) | | | | | |
| Trend estimates |
26 298 |
26 513 |
26 678 |
1 |
| Seasonally adjusted |
26 062 |
26 306 |
27 116 |
3 |
| DEBITS (Imports of goods and services) | | | | | |
| Trend estimates |
27 035 |
27 338 |
27 630 |
1 |
| Seasonally adjusted |
26 576 |
27 680 |
27 931 |
1 |
|
| |||||
