The US economy is definitely on a stronger footing than it was a year ago. It’s not gangbusters but the slow improvement continues and tapering in the next few months is shaping as a real prospect. There was more data overnight to support it. The Institute of Supply Management (ISM) released its August survey and contrary to the regional surveys it rose again after last month’s surge. The internals are positively glowing:
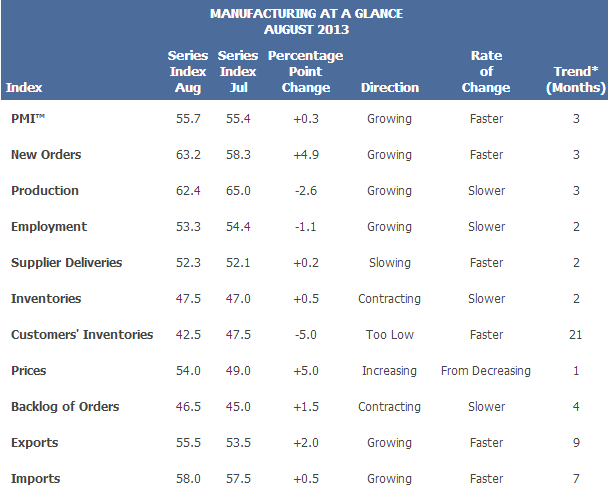
“The PMI™ registered 55.7 percent, an increase of 0.3 percentage point from July’s reading of 55.4 percent. August’s PMI™ reading, the highest of the year, indicates expansion in the manufacturing sector for the third consecutive month. The New Orders Index increased in August by 4.9 percentage points to 63.2 percent, and the Production Index decreased by 2.6 percentage points to 62.4 percent. The Employment Index registered 53.3 percent, a decrease of 1.1 percentage points compared to July’s reading of 54.4 percent. The Prices Index registered 54 percent, increasing 5 percentage points from July, indicating that overall raw materials prices increased when compared to last month. Comments from the panel range from slow to improving business conditions depending upon the industry.
This report rather smells of global recovery. As well, Census Bureau data indicates that ongoing recovery in construction data:
The U.S. Census Bureau of the Department of Commerce announced today that construction spending during July 2013 was estimated at a seasonally adjusted annual rate of $900.8 billion, 0.6 percent above the revised June estimate of $895.7 billion. The July figure is 5.2 percent above the July 2012 estimate of $856.3 billion.
…
Spending on private construction was at a seasonally adjusted annual rate of $631.4 billion, 0.9 percent above the revised June estimate of $625.6 billion. …
In July, the estimated seasonally adjusted annual rate of public construction spending was $269.4 billion, 0.3 percent below the revised June estimate of $270.1 billion.
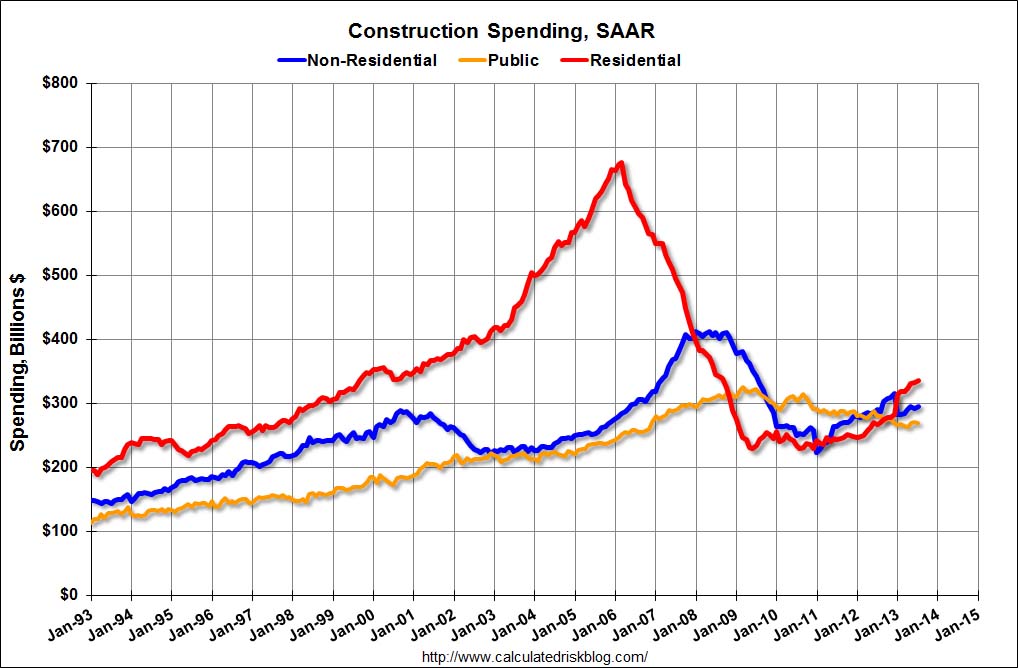
To repeat a few key themes: 1) Private residential construction is usually the largest category for construction spending, and is now the largest category once again. Usually private residential construction leads the economy, so this is a good sign going forward.2) Private non-residential construction spending usually lags the economy. There was some increase this time for a couple of years – mostly related to energy and power – but the key sectors of office, retail and hotels are still at very low levels. I expect private non-residential to start to increase later this year.3) Public construction spending decreased in July. Public spending has declined to 2006 levels (not adjusted for inflation) and has been a drag on the economy for 4 years. In real terms, public construction spending has declined to 2001 levels.
This solid data flow unsurprisingly sent bond yields to the moon with the 10 year up 3.6% to 3.85% and the 30 year up 2.7% to 3.78%. These are huge moves in the world’s biggest bond market and although yields remain below their recent highs, data like this will see them break out.
David Llewellyn-Smith is Chief Strategist at the MB Fund and MB Super. David is the founding publisher and editor of MacroBusiness and was the founding publisher and global economy editor of The Diplomat, the Asia Pacific's leading geo-politics and economics portal.
He is also a former gold trader and economic commentator at The Sydney Morning Herald, The Age, the ABC and Business Spectator. He is the co-author of The Great Crash of 2008 with Ross Garnaut and was the editor of the second Garnaut Climate Change Review.