
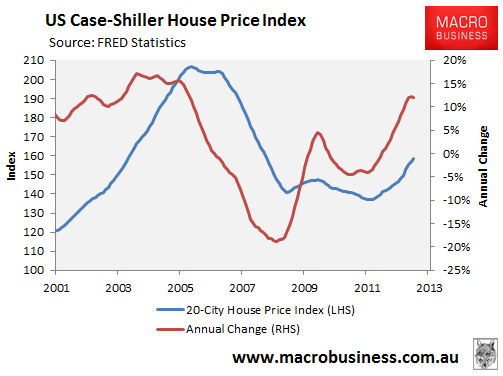
The recovery of the US housing market continues, with the release of the Case-Shiller 20-city house price index last night recording its 15th consecutive monthly gain, with prices rising by a seasonally adjusted 0.9% in June, by 12.0% year-on-year, and by 15.7% since values bottomed in January 2012. However, house prices still remain -23% below peak, according to Case-Shiller (see next chart).
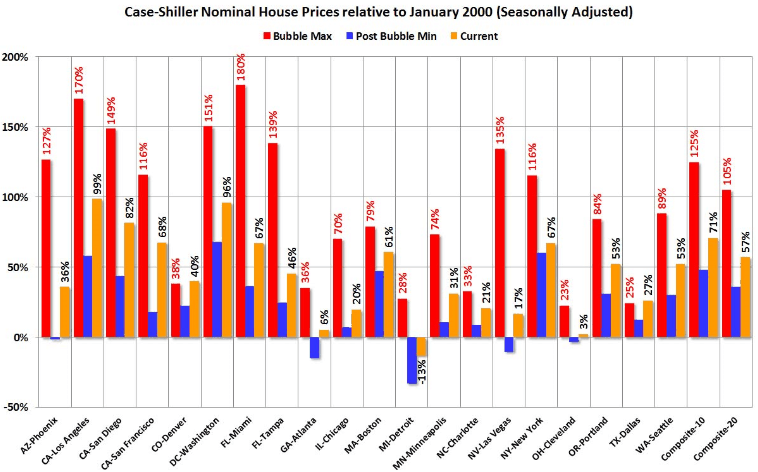
The next chart, which comes from Bill McBride at Calculated Risk, shows the bubble peak, the post bubble minimum, and current nominal prices relative to January 2000 for all the Case-Shiller cities in nominal terms.
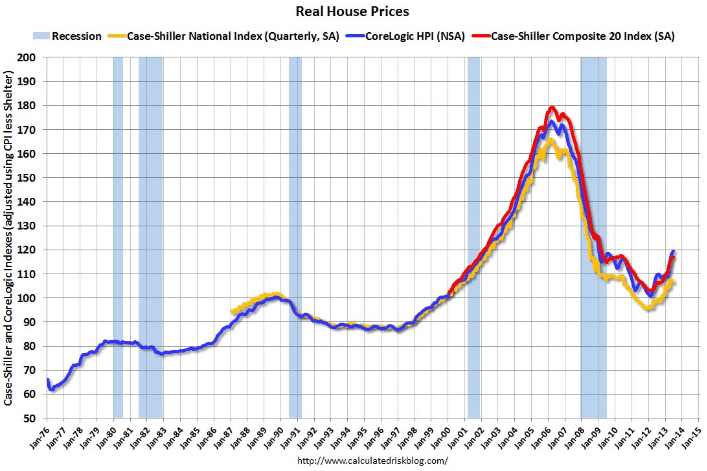
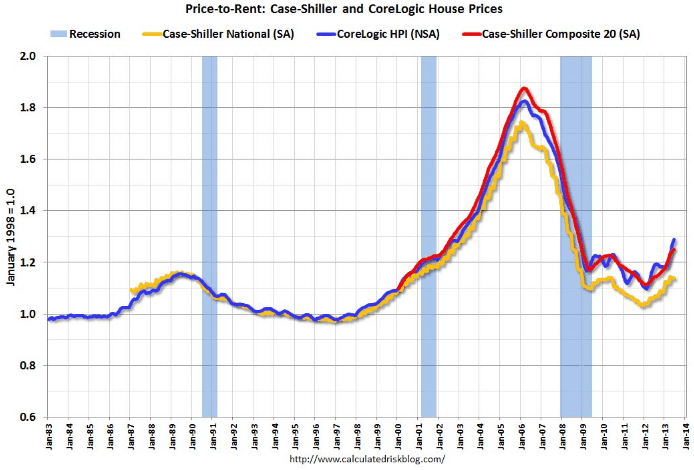
At the national level, real inflation-adjusted US house prices are back at early 2000 levels, according to McBride:
Whereas prices-to-rent are also at early 2000 levels:
The mood of US consumers has also followed prices upwards. Both the University of Michigan and Conference Board consumer sentiment indexes have registered increases over the past year, tracking near their highest levels in more than five years (see next chart).
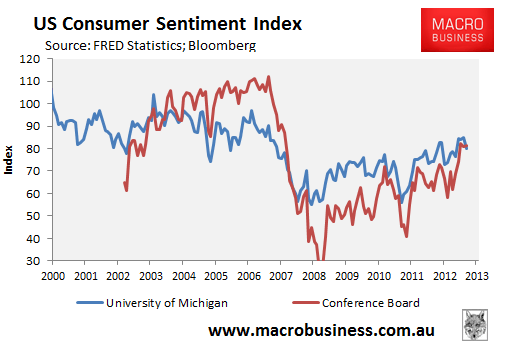
There is typically a strong relationship between consumer sentiment and house prices, suggesting that price momentum is likely to be maintained.
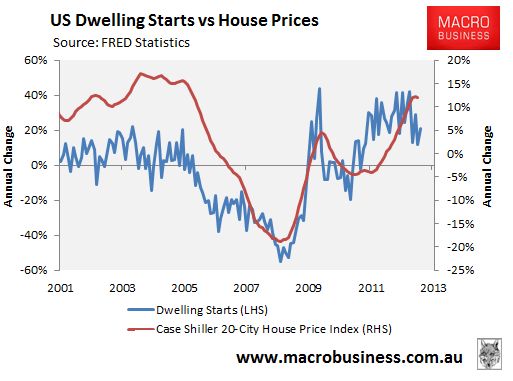
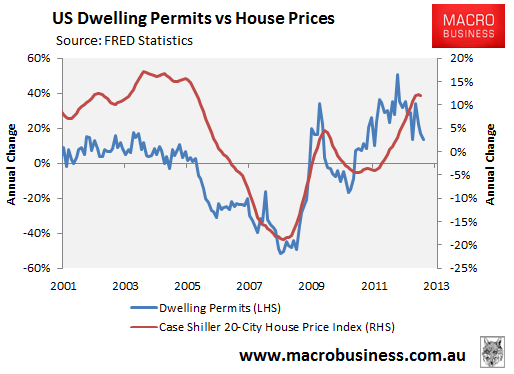
Meanwhile, US housing construction typically follows house prices, suggesting the surge in price growth and sentiment should continue flowing into the real economy (see below charts).
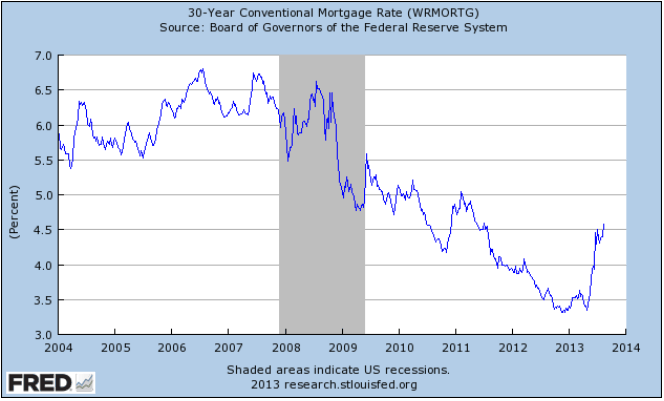
However, question marks remain over the sustainability of the recovery, given the recent significant rise in the 30-year mortgage rate, which adversely affects the cost of financing and reduces the size of the loan that can be taken on by a potential buyer for a given monthly outlay (see next chart).
According to Trulia, the US housing market is 64% back to normal, compared with just 36% one year ago. The housing market is also in its “third phase”:
The first phase of the recovery began in 2009, when the housing market ended its free fall and both sales and construction started their long, slow climb back from the bottom.
The second phase began in early 2012, when home prices bottomed and started their steep rebound.
We are now in phase three, which began in spring 2013, after inventory bottomed in January and mortgage rates started to rise in May. Both are making their climb after reaching historic lows, while price gains are slowing down. Existing-home sales have returned to near-normal levels, as have prices, which now look just 5% undervalued.
The fourth phase – which will begin when young adults finally start moving out of their parents’ homes, boosting household formation – is yet to come. Until this happens, construction and new home sales will remain well below normal – even though prices and existing-home sales are now very close to their normal, sustainable levels.
