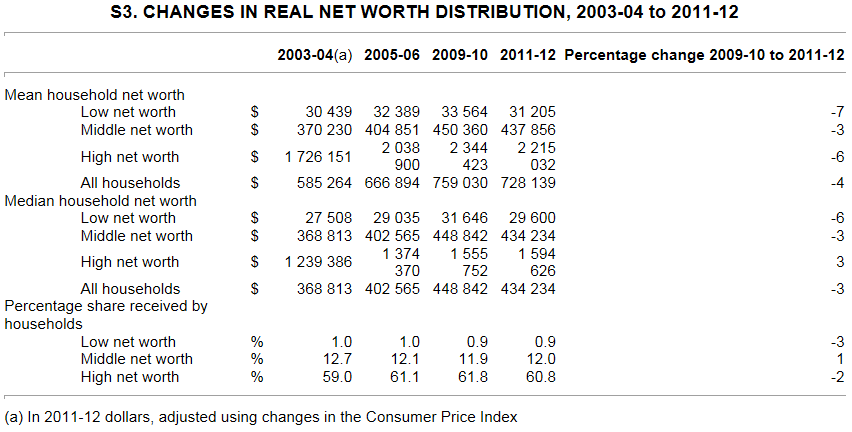
The Australian Bureau of Statistics (ABS) has today released its biennial Household Wealth and Wealth Distribution Survey, which covers the two years to 2011-12. According to the Survey, real median and mean household wealth fell over the two year period, most likely reflecting the fall in housing values, which are by far household’s biggest asset (see below table).
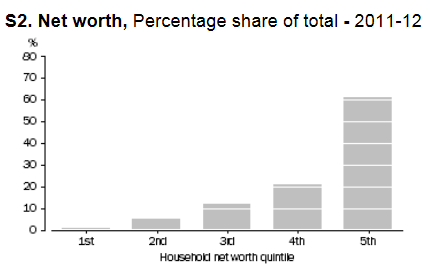
The ABS data also shows that in 2011-12, the top 20% of households held 60% of total net worth, while a further 21% was held by households in the 4th quintile. By comparison, the lowest three quintiles held, in total, 18% of total net worth (see next chart).
Advertisement
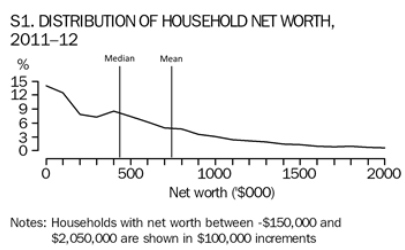
The asymmetric distribution of wealth can also be seen in the differences between mean (i.e. average) net worth and the median (i.e. the mid-point when all households are ranked in ascending order of net worth). Whereas mean household net worth in Australia in 2011-12 was $728,000, the median was substantially lower at $434,000 (see next chart).
Advertisement
According to the ABS:
Owner occupied properties were the largest asset held by households, accounting for 43% of household assets and represents a value of $370,000 (table 6) when averaged across all households…
Balances in superannuation funds were the largest financial asset held by households, averaging $132,000 per household across all households. Eighty percent of households had some superannuation assets, but the distribution is asymmetrical, with the third net worth quintile having a mean of $65,000, reflecting the relatively small number of households with high superannuation balances and the relatively large number of households with zero or low superannuation balances…
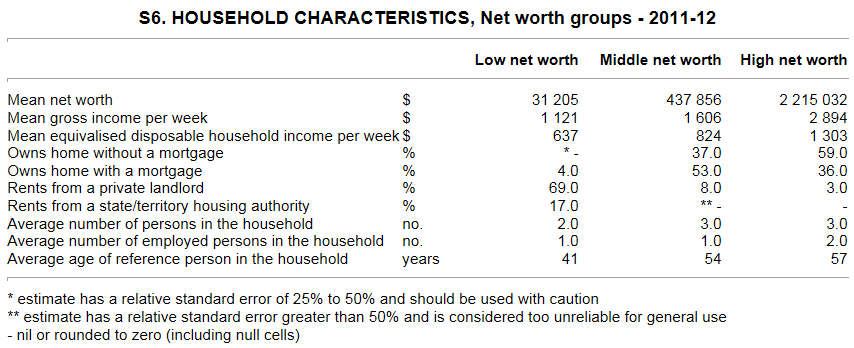
Low net worth households had lower equivalised disposable household income compared to middle and high net worth households ($637 per week, compared with $824 and $1303 per week, respectively).
High net worth households had the highest incidence of home ownership without a mortgage (59%), whereas 91% of the households in the lowest net worth quintile were renters. High net worth households contained more people on average (2.8) than the low and middle net worth groups (2.3 and 2.5) and more employed persons on average (1.5) compared with low and middle net worth households (0.9 and 1.2, respectively)…
The average age of the household reference person was older in the high net worth group (57 years) compared to the middle net worth group (54 years) and the low net worth group (41 years), reflecting that wealth generally accumulates with age.
There is a strong correlation between net worth and home ownership, and for many households, their dwelling is their main asset.
Owners without a mortgage had the highest mean net worth ($1,237,000) which is 70% higher than the mean net worth of all households ($728,000). The mean net value of owner occupied dwellings for this group was $546,000 or 44% of their total mean net worth.
Owners with a mortgage also had higher mean net worth ($790,000) than the average for all households. This group also had higher liabilities than the average for all households ($288,000 compared with $130,000). Almost three-quarters (71%) of their liabilities were from the principal outstanding on loans for owner occupied dwellings.
Renters had lower mean net worth ($160,000) which is 22% of the average for all households. Private renters averaged net worth of $179,000, while renters from state/territory housing authorities averaged net worth of $43,000…
Household net worth varies between states and territories. In 2011-12 Tasmanian households recorded the lowest mean net worth at $601,000, or 17% below the average for all Australian households. Canberra (ACT) households had a mean net worth of $930,000, 19% above the capital city average of $781,000 and 28% above the average for all Australian households of $728,000. Household net worth was also higher in capital cities compared to other areas. The mean net worth of $781,000 for capital city households was 22% above the mean for households in the remainder of Australia of $638,000.
Leith van Onselen is Chief Economist at the MB Fund and MB Super. He is also a co-founder of MacroBusiness.
Leith has previously worked at the Australian Treasury, Victorian Treasury and Goldman Sachs.