

Cross-posted from Kate Mackenzie at FTAlphaville.
The China July trade data came in surprisingly strong, and even the detail holds up fairly well — apart from a few notable quibbles.
Whether you interpret it as a sign that the growth rate has bottomed out, or just that external demand has stabilised, probably depends on how you already view Chinese growth.
On to the good, the bad and the confusing in the trade data. Here’s how we summarised the headlines in the 6am Cut:
Exports rose 5.1% for July, year-on-year, compared to a median forecast of 2%. Import growth was even stronger at 10.9%, while the median forecast was for only 1%.
SocGen’s Wei Yao has some interesting observations. The year-on-year export growth rate, she says, benefits from a base effect — the July 2012 data displayed an unusual decline from the previous month.
The import data, however, has no such obvious issues (apart from the little matter of Taiwan). Emphasis ours:
In comparison, the bounce of import growth from -0.9% yoy to +10.9% yoy without any base effect was much more surprising and difficult to explain. By origin, there was improvement across the board and the major contributors were the euro area, Taiwan, Korea and Australia. Imports from the euro area rose 8.3% yoy in July, improving for two months in a row. However, we noticed that the difference between China’s data and Taiwan’s diverged again. Chinese imports from Taiwan grew 16.6% yoy in July (vs. 6.7% in June) using the mainland’s data, but increased only 1.1% yoy (vs. 8.6% in June) using Taiwan’s data.
Import data is a good indicator for China’s own domestic growth, as the country’s reliance on exports for growth has diminished in the past few years. And the growth in the segment of imports for domestic consumption — that is, ex-commodities and ex-products for “reprocessing” and export — was even stronger, at 13.9 per cent year-on-year, compared to 7.3 per cent in June.
However, the import strength is not necessarily a good indicator for the Q3 GDP growth numbers. Yao points out that the stronger relative performance of imports vs exports means the trade surplus is narrowing — something that is likely continue in the coming months due to the base effect, she says. And this shows up on national accounts as a negative for GDP growth.
Oh, and remember the new copper financing deal that we explained last month? Goldman dubbed it “cash for copper”, as opposed to a somewhat different copper financing practice that emerged over the previous few years.
Well, commodities imports were up a lot, and at least some of it might have to do with financing, Barclays’ Sijin Chen writes:
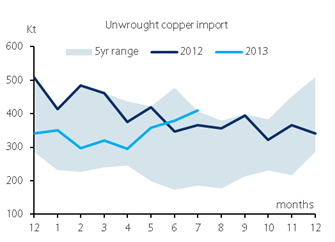
Unwrought copper and semi imports gained 8% m/m to 410.7Kt, an increase of 12% from July 2012. Imports surged since May as arb opened and traders sought fresh copper imports to obtain financing, since the regulators cracked down on entrepot copper imports that sat in bonded warehouses.
The unwrought copper imports do look historically high:
One last point: remember how the HSBC/Markit manufacturing PMI diverged rather sharply (again) from the official one? Both of them showed growth in new export orders continuing to contract, albeit at a reduced pace from June.
