
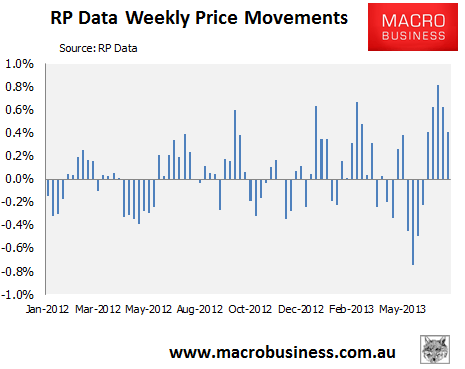
In the week ended 11 July 2013, the RP Data-Rismark 5-city daily dwelling price index, which covers the five major capital city markets, recorded a 0.41% increase. It was the fifth consecutive weekly rise in values (see next chart).
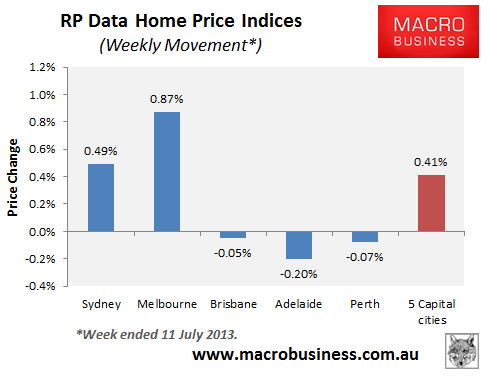
Results were mixed, with strong growth in Melbourne and Sydney more than offseting small falls in the other major capitals (see next chart).
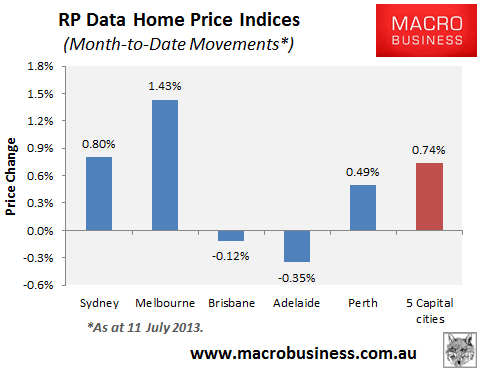
Values are up 0.74% so far in July, with three major capitals recording rises and two falls (see next chart).
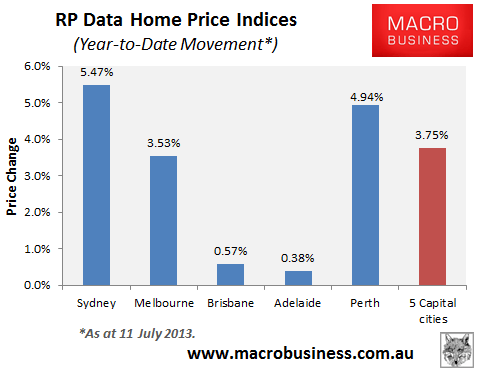
Since the end of last year, home values have risen by 3.75% at the 5-city level, with all markets experiencing gains (see next chart).
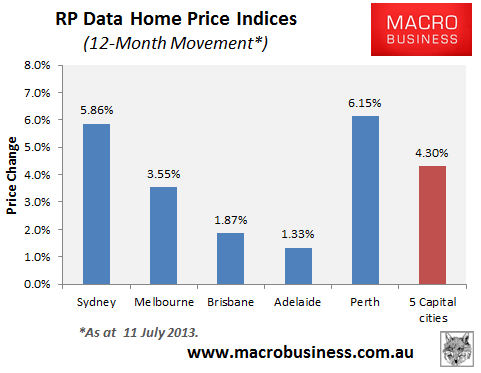
Over the past 12 months, values have risen by 4.30% at the 5-city level, with all major markets experiencing increases (see next chart).
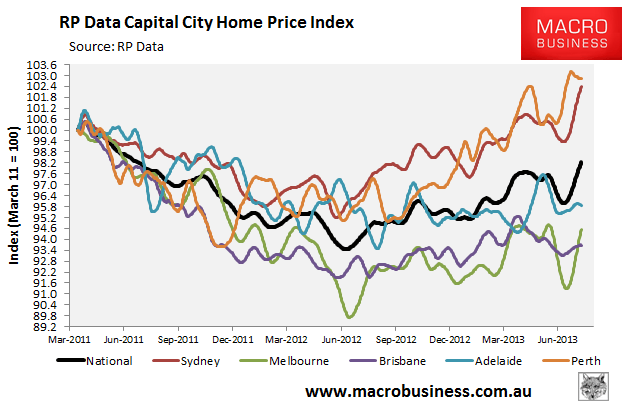
The next chart plots the daily movements on a 14-day moving average, in order to smooth volatility. As you can see, the uptrend has resumed, driven by strong gains in Perth and Sydney. Melbourne, Brisbane, and Adelaide, on the other hand, look range bound (see next chart).
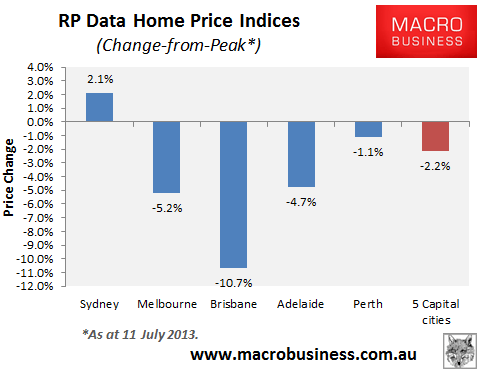
Values are down 2.2% since peak at the 5-city level, with all major capitals except Sydney in negative territory (see next chart).
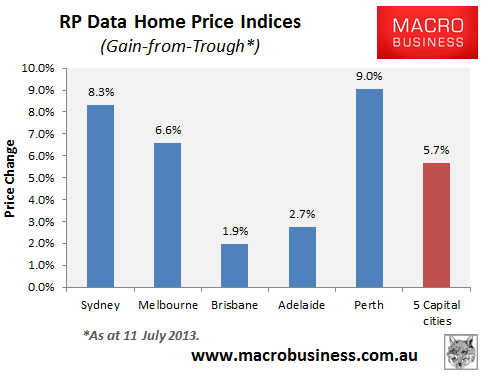
However, major capital home values have now gained 5.7% since bottoming in May 2012, with all capitals rebounding (see next chart).
Note: readers are advised not to read too much into short-term movements in the RP Data daily index. This index is incredibly volatile and not seasonally adjusted, hence it can give false readings when interpreted over a shorter-term timeframe. There is also evidence suggesting the RP Data daily index is a lagging indicator for the quarterly ABS house price series (see here). Caveat emptor.
