
The release of new home sales and approvals data for May has enabled me to compare new house sales, as provided by the Housing Industry Association (HIA), against house approvals, as provided by the Australian Bureau of Statistics (ABS), in order to indicate whether Australia’s various house-and-land package markets might be experiencing under/oversupply.
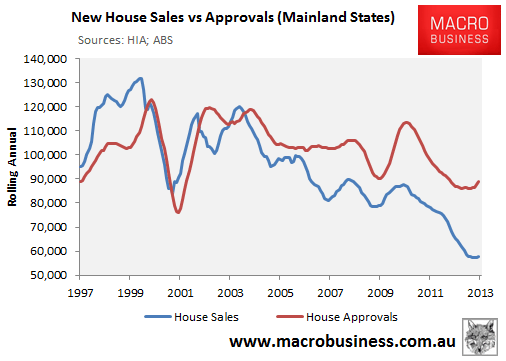
The next chart compares this data at the mainland state level – ie. the sum of New South Wales, Victoria, Queensland, Western Australia, and South Australia. As you can see, new house sales appear to have fallen more sharply than approvals, and have recovered less quickly, suggesting that a glut of unsold new houses may have developed across the mainland.
Charts for each of the mainland states are provided below. As you can see, there are large variations between the states, with the stock of unsold new houses appearing to be highest in Victoria, Queensland, and South Australia. By comparison, New South Wales looks to have experienced a smaller increase in the stock of unsold new houses, whereas Western Australia looks to have developed a shortage.
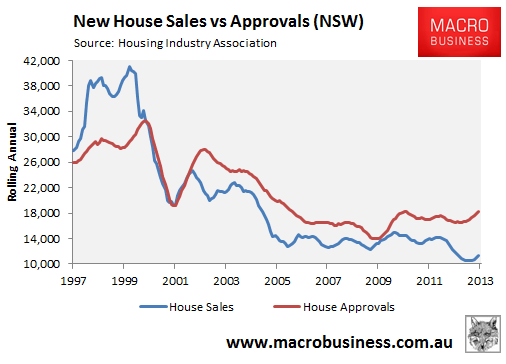
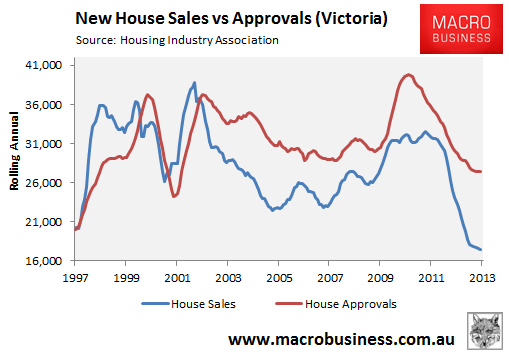
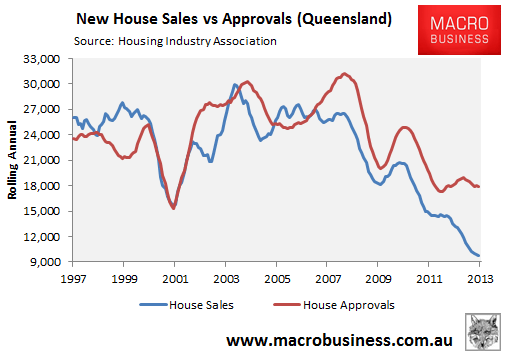
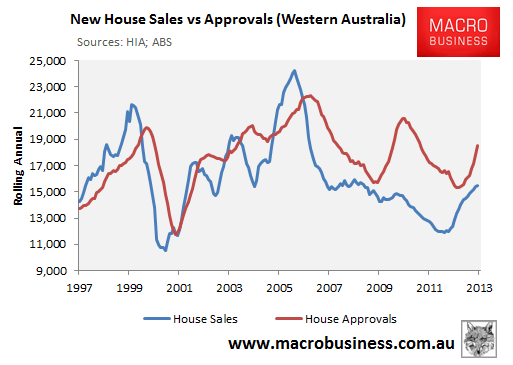
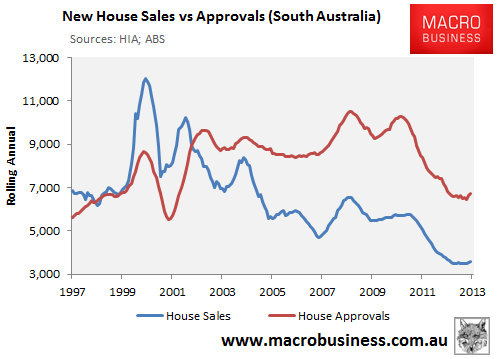
Note: since the data are drawn from different sources and samples, care should be taken when drawing conclusions. The ABS’ approvals data also includes alternations and additions to an existing dwelling, and can include replacement of existing dwellings (i.e. knockdown and rebuilds). Further, just because something is approved doesn’t mean it gets built. Hence, this analysis is indicative only of where under/oversupply of new houses may exist, not irrefutable proof.
unconventionaleconomist@hotmail.com
