

Cross-posted from Tiho at The Short Side of Long.
Equities
Chart 1: VIX & S&P 500 divergence continues…

Source: Short Side of Long
- While not an outright sentiment indicator, Volatility Index (VIX) usually tends to lead the S&P 500 lower. Red divergence lines, in the chart above, show how VIX refuses to make a lower low while the stock market moves higher. Disagreement tends to be a warning signal majority of the time (doesn’t always work). It seems that traders tend to buy protection in anticipation of an up-and-coming corrections. This is definitely a warning signal, which we’ve seen time and time again, throughout the current bull market.
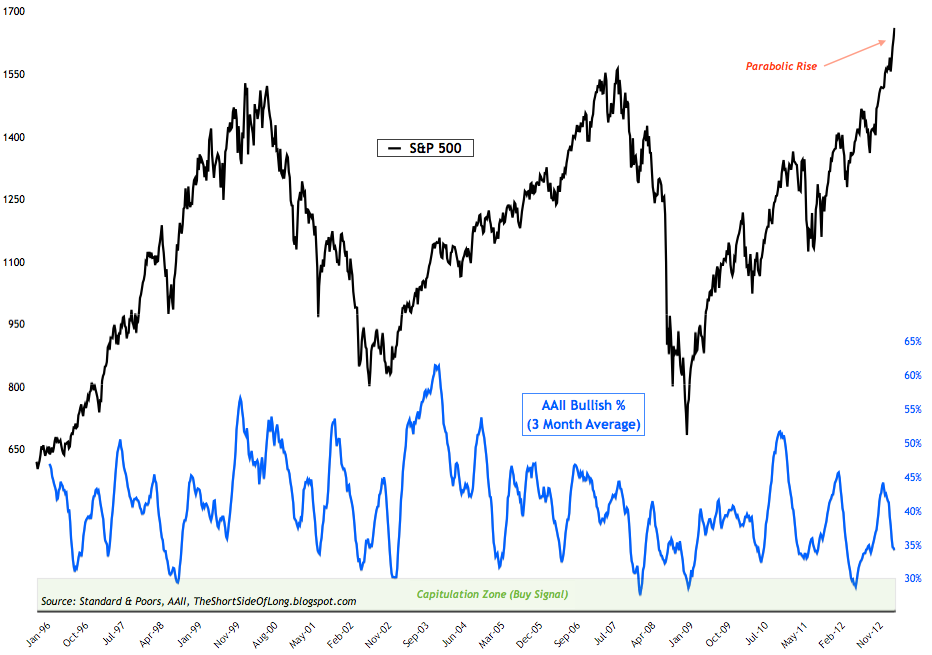
Chart 2: Investors not enthusiastic about the parabolic rally?
Source: Short Side of Long
- This weeks AAII survey levels came in at 38.5% bulls and 29% bears. Bullish and bearish readings pretty much stayed the same from the prior weeks level. As already commented in previous sentiment posts, AAII sentiment levels remain below average, despite a parabolic rise in stock prices. However, this is not so rare. During a powerful stock rally in late 2006 and into early 2007, AAII sentiment was falling just as the market was peaking. In general, this indicator is much much better at predicting intermediate bottoms.
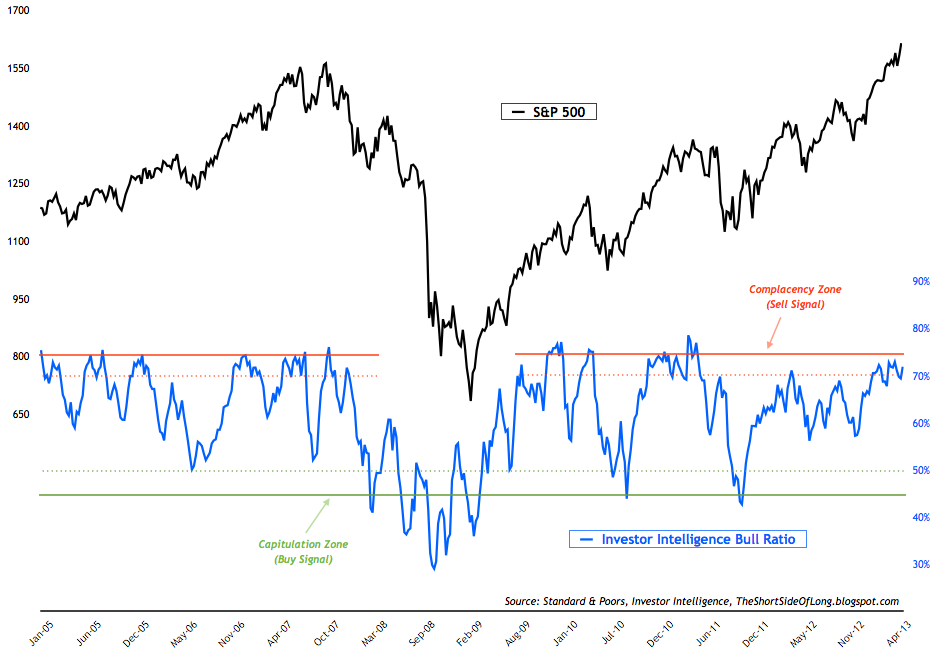
- Investor Intelligence survey levels came in at 54% bulls and 20% bears. Bullish readings rose by 2%, while bearish readings stayed exactly the same. Bull ratio remains on a “sell signal” and has now exceeded 73%, which is the highest level since the major market top in 2011. For referencing, the bull ratio chart can be seen by viewing the sentiment post from two weeks ago or by clicking clicking here.
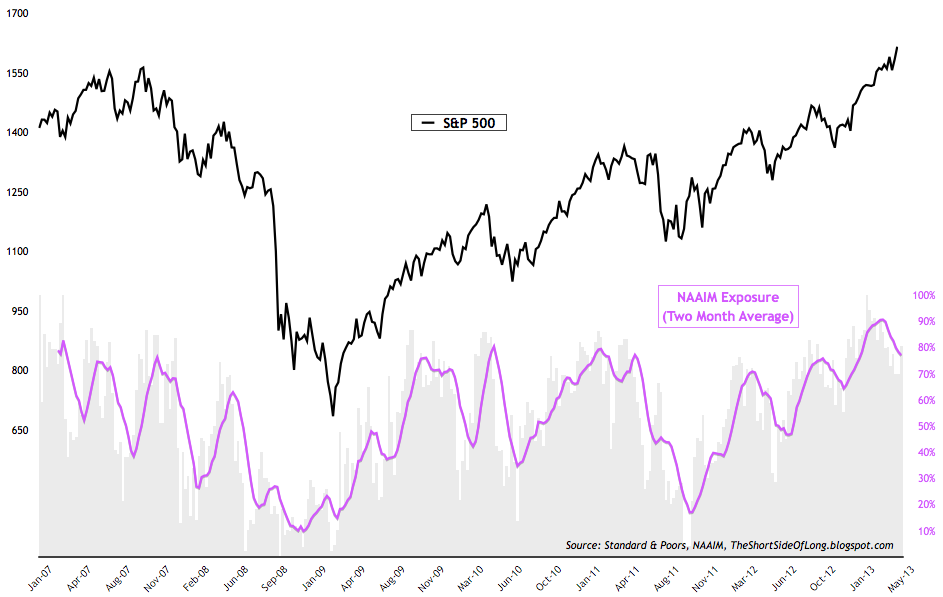
- NAAIM survey levels came in at 84% net long exposure, while the intensity came in at 164%. Net long exposure remains near some of the highest levels since the surveys inception, but so far the sell signal has not worked. Stocks remain in their parabolic run up. Recent NAAIM sentiment chart can be seen by clicking here.
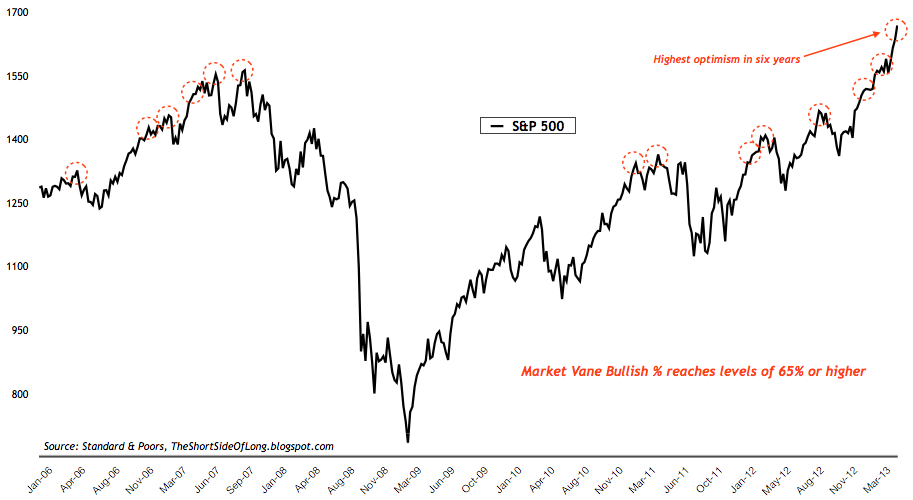
Chart 3: Market Vane optimism is now at the highest in 6 years
Source: Short Side of Long
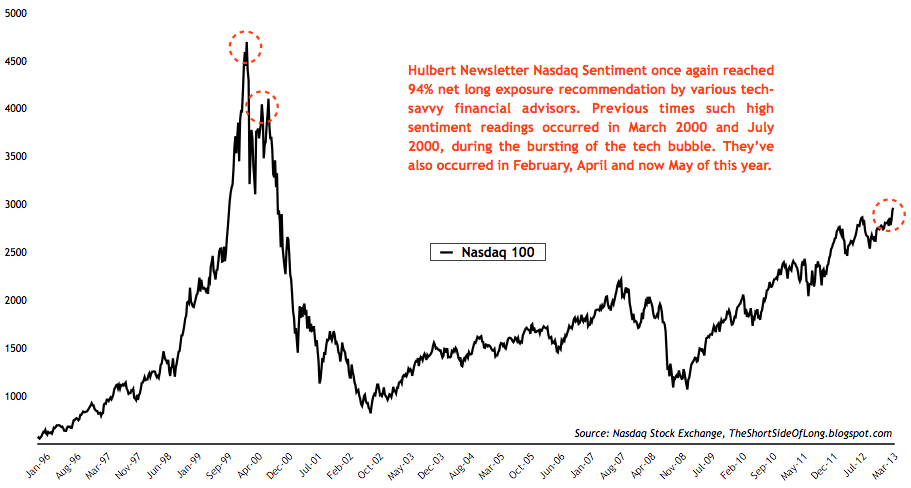
- Other sentiment surveys continue to signal extremely overbought market conditions. Consensus Inc survey remains at extremely elevated level associated with previous market tops. Market Vane survey, seen in the chart above, rose to a reading of 70% bulls for the first time in 6 years. The chart shows all of the instances when bullish sentiment became elevated (65% bulls or more). Interestingly, while the rally sometimes lasted for a few more weeks or months, all of the gains were eventually given back. Hulbert Newsletter Stock surveys has now risen to 70% net long exposure – also the highest level in more than 6 years. Furthermore, Hulbert Newsletter Nasdaq Stock Index remains at extremely high levels last seen 13 years ago during the tech mania. Last weeks chart of the can be seen by clicking here.
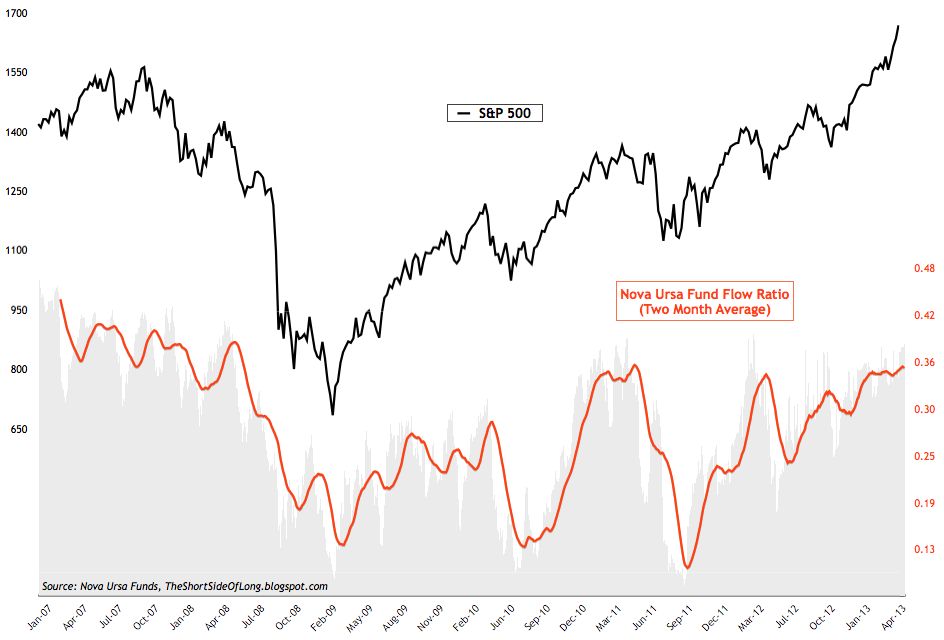
Chart 4: Nova Ursa fund flows remain at overly bullish levels
Source: Short Side of Long
- This weeks ICI fund flows report showed equity funds had estimated inflows of $3.46 billion for the week, compared to estimated outflows of $4.41 billion in the previous week. Recent ICI equity fund flow chart can be seen by clicking here. Sending out a very similar message is the Rydex fund flows tracked via Nova Ursa funds, seen in the chart above. Leave of capital entering bullish funds by and large outnumbers the capital entering bearish funds. The two month average has also risen and remained at elevated levels, while the S&P continues its parabolic rise.
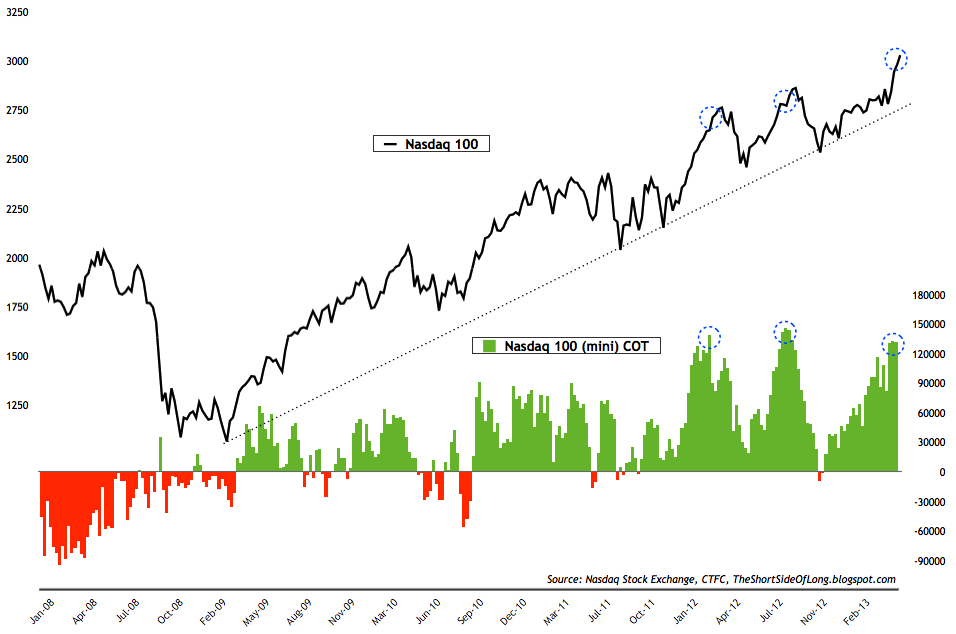
Chart 5: Hedge funds bullish bets on tech stocks is persistent
Source: Short Side of Long
- Latest commitment of traders report showed that hedge funds and other speculators continue to hold an extremely high net long position on technology stocks. This weeks contract position came in at over 130 thousand net longs for the third week running. We are not too far of from record levels of net long exposure.
Chart 6: Retail investors are jumping into call options
Source: SentimenTrader
- Retail investor option positioning, tracked by equity only options, is showing extreme signs of call purchasing. Usually, but not always, this results in some type of a short term pullback. However, it needs to be said that option data is quite volatile, so the signals it gives out aren’t always perfect. Furthermore, large number of put purchases do a better job at signalling a bottom than a large number of call purchases when it comes to calling tops.
Bonds
- Bond sentiment surveys remain around neutral territory. Both the Consensus Inc survey and Market Vane survey still remain dead smack in the middle of the bull vs bear percentage readings. Hulbert Newsletter Bond survey is closer to extremely high net long exposure levels. Last weeks chart can be seen by clicking here. All in all, sentiment surveys do not give much to a contrarian trader, but as already stated on many occasions, for the long term investor – this asset class remains extremely overvalued after a 31 year bull market.
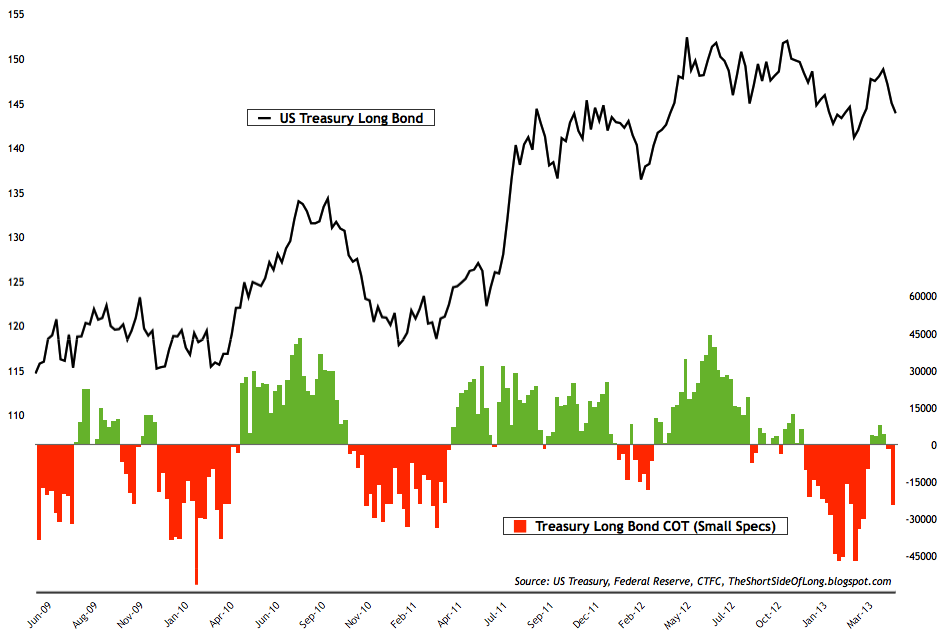
Chart 7: Small specs have started shorting Treasuries again…
Source: Short Side of Long
- Recent commitment of traders report shows that after a short squeeze rally, which occurred over the last month or so, small speculators (also referred to as dumb money) have once again turned negative on the Treasury Long Bond. These traders have now initiated short bets in excess of 20,000 contracts. Having said, it is important to understand that net short positions could resume while the price sell offs, the same way that net long positions persisted since February 2011 low. Technical traders are also looking at the recent failed rally as a first lower high in two and half years.
Commodities
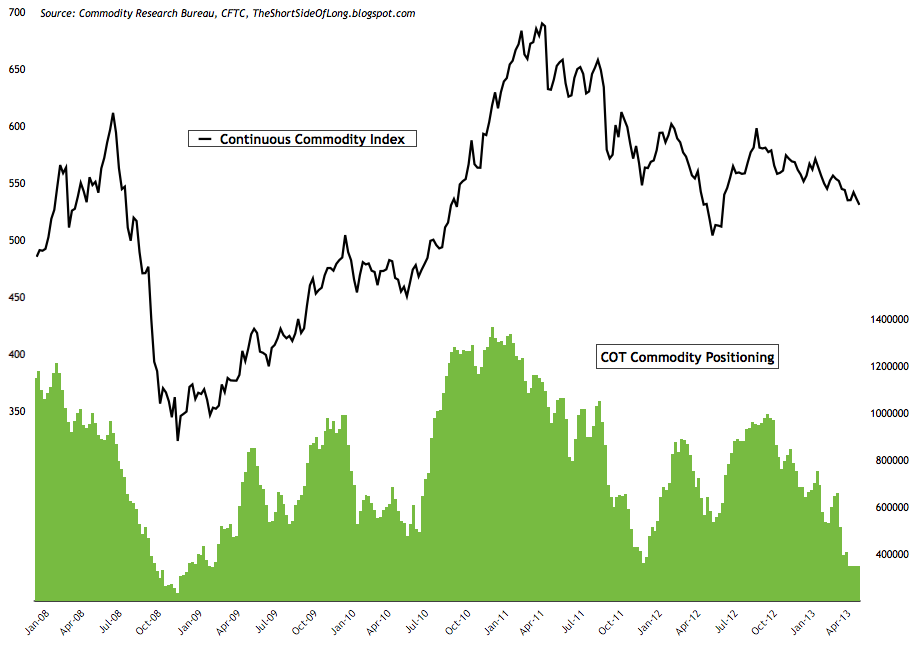
Chart 8: Funds are holding extremely low commodity exposure
Source: Short Side of Long
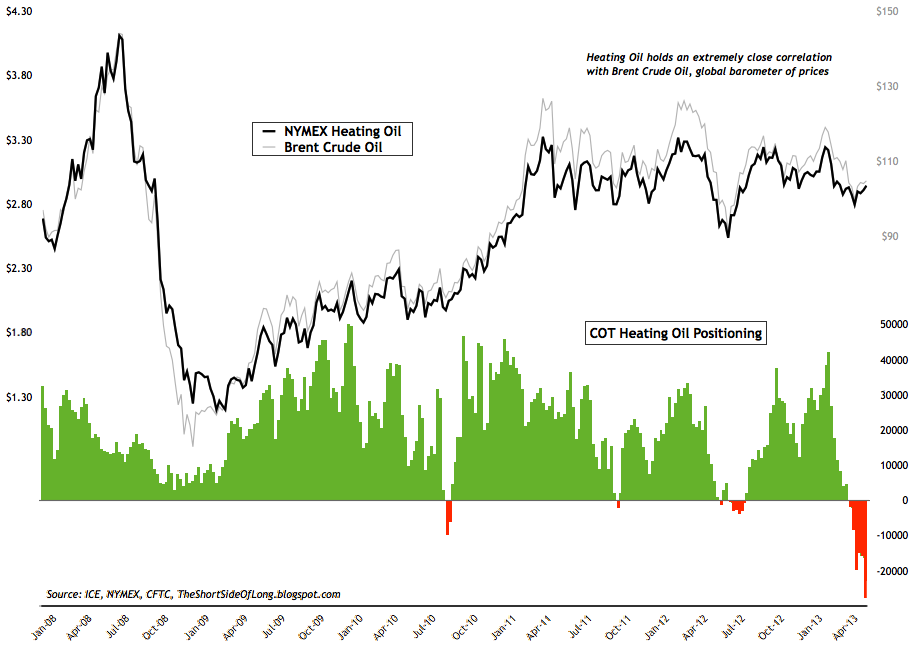
- Latest commodity commitment of traders report showed that hedge funds and other speculators continue to hold extremely low exposure towards commodities for the third week in the row. For the fourth week in the row, hedge fund net long contracts on commodities remain around 345,000. Short positions are held on commodities such as Copper, Sugar, Wheat and in particular Heating Oil. The chart below shows record net short positions:
Chart 9: Traders have become extremely negative on Energy
Source: Short Side of Long
- Commodity Public Opinion surveys have rebounded from extremes in recent weeks. Having said that, industrial commodities like Heating Oil (energy) and Copper (metals) are still quite disliked amongst investors.
Currencies
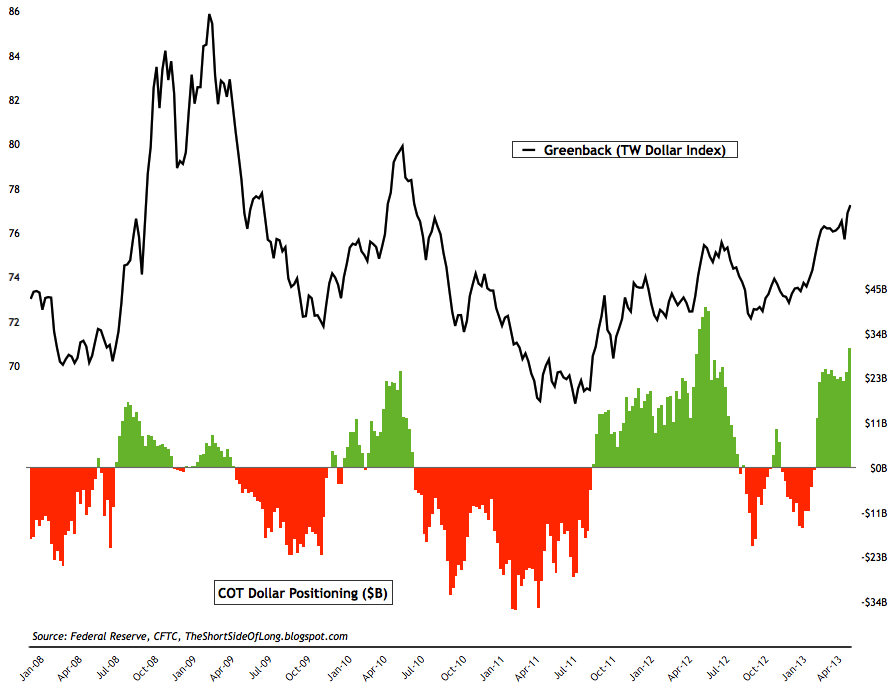
Chart 10: Hedge funds increase their bets on the US Dollar
Source: Short Side of Long
- Latest currency commitment of traders exposure towards the US Dollar continues to increase on the net long side. Cumulative Dollar positioning stands at over $30 billion for only the fifth week over the last decade and half. Other four weeks occurred around June 2012, as the EU Crisis was in full swing. Largest bullish bets on the Dollar are against currencies such as Japanese Yen, British Pound, European Euro and Canadian Dollar. Traders are now short every single major G-10 currency in the Trade Weighted Dollar Index, apart from the Kiwi Dollar.
- Currency Public Opinion survey readings on the US Dollar are staying near some of the highest levels of optimism. As explained in previous weeks, this has mainly been a result of ongoing pessimism towards the European Euro and the Japanese Yen.
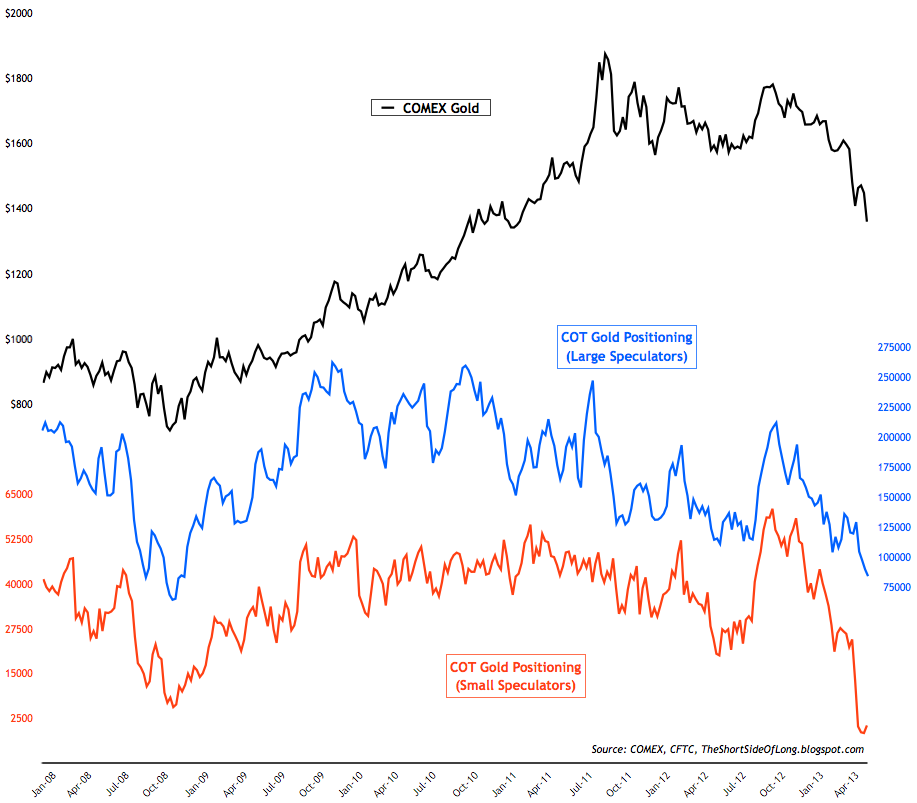
Chart 11: Bullish bets on Gold by hedge funds continue to fall
Source: Short Side of Long
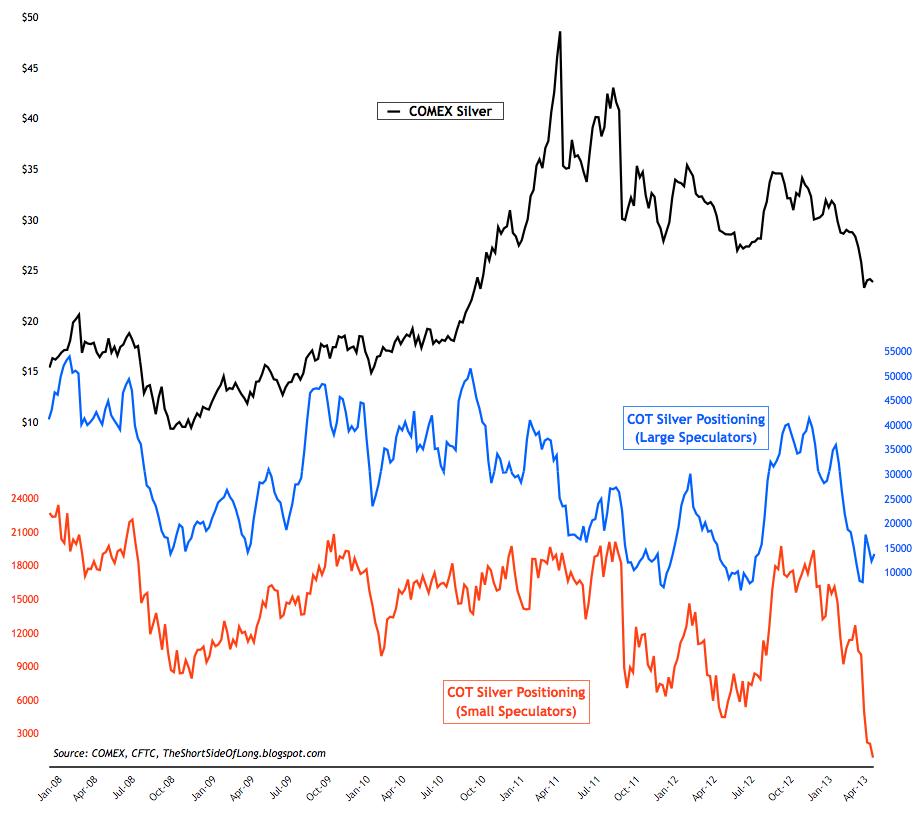
- Alternative currency commitment of traders report showed hedge funds and other speculators continuing to cut their net long contracts even further. In Gold, non commercial positions have now fallen below 84 thousand, while small speculators are in total panic with lowest net long exposure since 2001. Positioning in Silver was also decreased too. Hedge funds hold just over 10,000 net long positions. Last weeks chart can be seen by clicking here.
- Public opinion on alternative currencies like Gold and Silver is still around depressed and extreme pessimism levels associated with previous intermediate bottoms. With the recent sell off in price, we are sure to see even less bulls in coming updates.
