
Courtesy of Mark the Graph.
I have spend the past week collecting polling data from the major polling houses. Nonetheless, I still have a ways to go in my project of building a Bayesian-intelligent aggregated poll model. Indeed, I have a ways to go on the simple task of data collection.
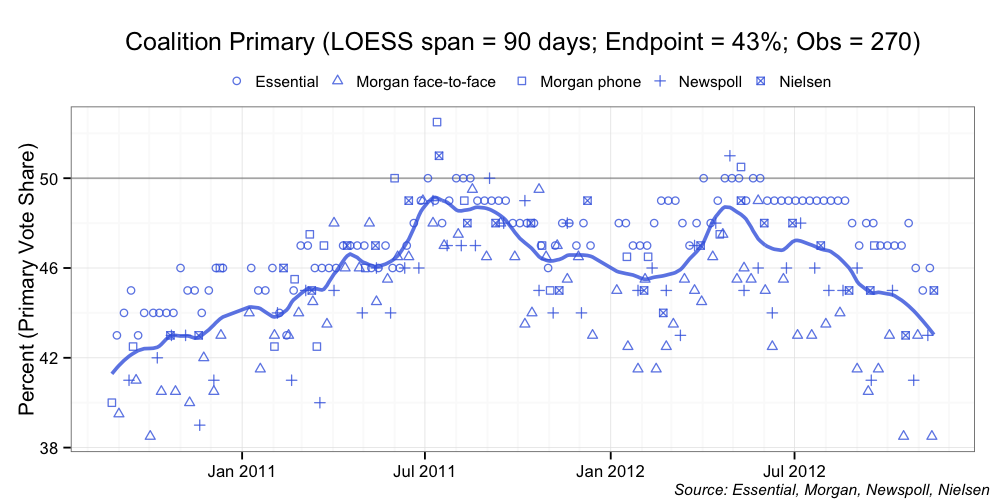
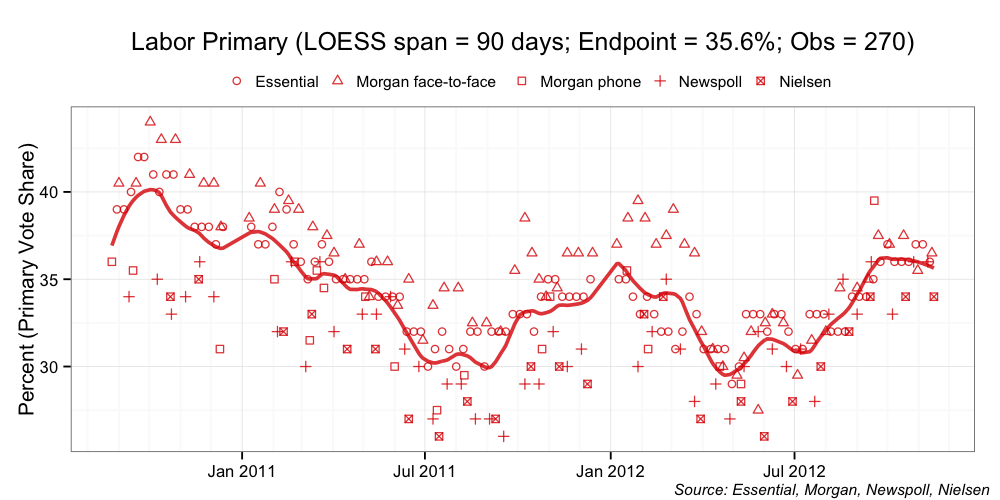
I can, however, plot some naive aggregations and talk a little of their limitations. These naive aggregations take all (actually most at this stage in their development) of the published polls from houses of Essential Media, Morgan, Newspoll and Nielsen. I place a localised 90-day regression over the data (the technique is called LOESS) and voila: a naive aggregation of the opinion polls. Let’s have a look. We start with the aggregations of the primary vote share.


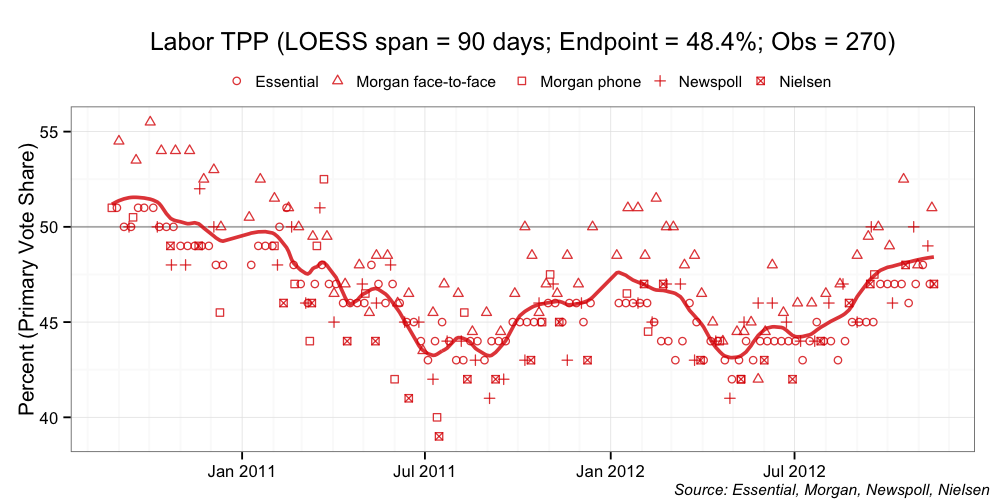
And on to the two-party-preferred aggregations.

So what are the problems with these naive aggregations? The first problem is that all of the individual poll reports are equally weighted in the final aggregation, regardless of the sample size of the poll. The aggregation also does not weight those polls that are consistently closer to the population mean at a point in time compared with those polls that exhibit higher volatility.
The second problem is that Essential Media is over-represented. Because its weekly reports are an aggregation of two fortnight’s worth of polling, each weekly poll effectively appears twice in the aggregation. In the main, the other polling houses do not do this (although, Morgan does very occasionally). Essential Media also exhibits a number of artifacts that has me thinking about its sampling methodology and whether I need to make further adjustments in my final model. I should be clear here, these are not problems with the Essential Media reports; it is just a challenge when it comes to including Essential polls in a more robust aggregation.
The third problem is that the naive aggregation assumed that individual “house effects” balance each other out. Each polling house has its own approach. These differences go to hundreds of factors, including:
- whether the primary data is collected over the phone, in a face-to-face interview, or online,
- how the questions are asked including the order in which the questions are asked,
- the options given or not given to respondents,
- how the results are aggregated and weighted in the final report,
- and so on.
These differences in approach subtly influence the final poll results in a consistent manner over time. For some it manifests in a higher Greens/Other vote compared with the mainstream parties. For others it is the reverse. It also tends to give each house a very slight left or right bias in comparison with the other polling houses, While it is technically possible that the sum of these house effects may cancel out each other; with such a small number of regular polling houses in Australia, it is by no means guaranteed.
The fourth problem is that population biases are not accounted for. In most contexts there is a social desirability bias with which the pollsters must contend. When I attended an agricultural high school in south west New South Wales there was a social desirability bias among my classmates towards the Coalition. When I subsequently went to university and worked in the welfare sector there was a social desirability bias among my colleagues and co-workers towards Labor. At the national level, there is likely to be an overall bias in one direction or the other. Even if only one or two in a hundred people feel some shame or embarrassment in admitting their real polling intention to the pollster, this can affect the final results. The nasty thing about population biases is that they affect all polling houses in the same direction.
If these problems can be calibrated, they can be corrected in a more robust polling model, This would allow for a far more accurate population estimate of voting intention. An analogy can be made with a watch that is running five minutes slow. If you know that your watch is running slow, and how slow it is, you can mentally make the adjustment to arrive at meetings on time. But if you mistakenly believe your watch is on-time, you will regularly miss the start of meetings. With a more accurate estimate of voting intention, it is possible to better identify the probability of a Labor or Coalition win (or a hung Parliament) following the 2013 election.
Fortunately, there is a range of classical and Bayesian techniques that can be applied to each of the above problems. And that is what I will be working on for the next few weeks.
