Courtesy of Mark the Graph.
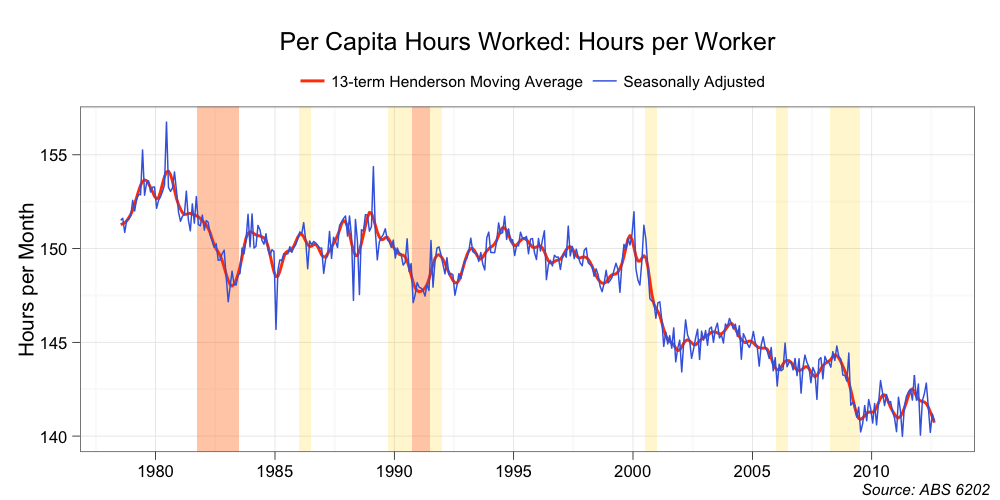
I came across an interesting observation yesterday. I was looking at the number of hours worked per worker (and whether it changed during periods of economic downturns). Not surprisingly, the long term trend has been down (we all know more people are working part-time). 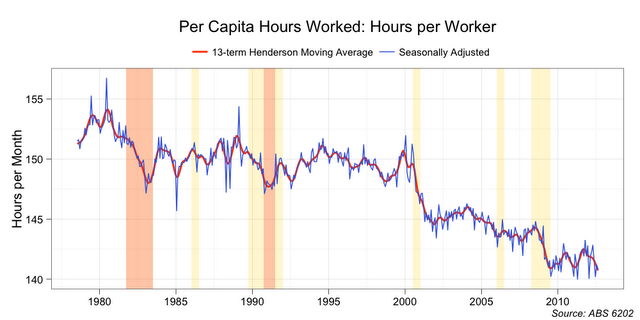
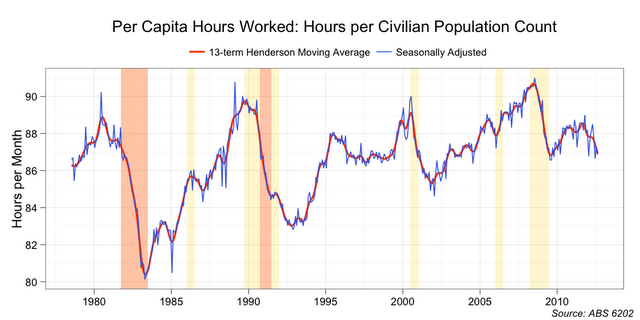
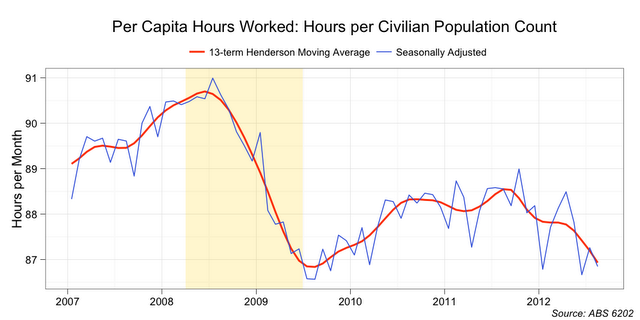
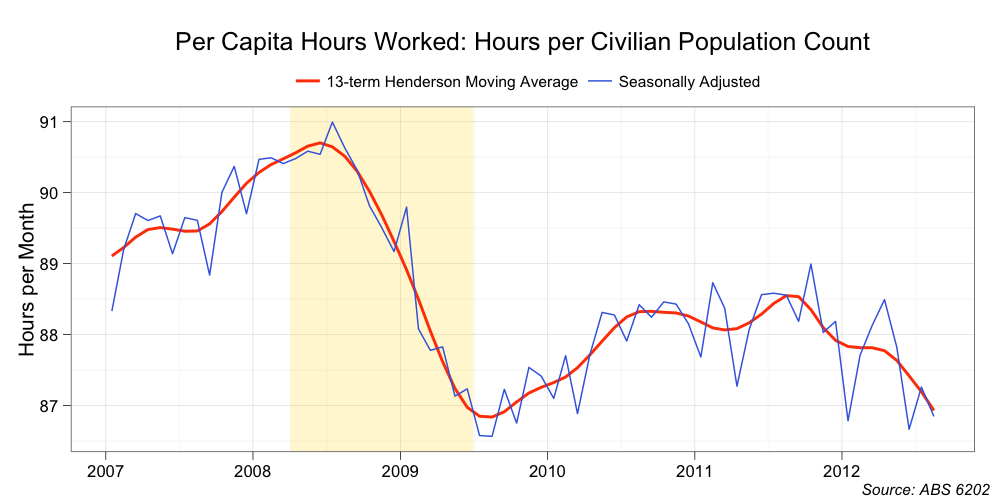
What caught my eye was hours worked per civilian population count.

This series has been remarkably flat over the past 25 years. It left me wondering why. Perhaps there is the natural cap on the capacity of households to contribute hours to national productivity. Perhaps, as women work longer hours (as has happened over the past 25 years) men work shorter hours; perhaps sharing the household responsibilities more as well.
The other thing that is clear, during times of downturn, the hours worked per civilian population count declines. Which brings us to the end of the chart. Is this latest slump more evidence of a slow softening in the labour market.