Cross posted with permission from Mark the Graph:
A week ago I posted on the tax table in the National Accounts. At that time I noted the drop in taxes paid by residential corporations. In response to the post, some people commented that I should present the taxes paid as a proportion of nominal GDP.
In today’s Australian, the the drop off in taxes paid by corporations was noted by David Uren.
Last week’s national accounts show company tax payments have fallen from an all-time peak of 6.2 per cent of gross domestic product in 2007 as Peter Costello delivered his last budget, to just 3.8 per cent in the June quarter.
This is the lowest share since September 1996, when Costello delivered his first budget. It is less than during the global financial crisis and erodes all the gains in corporate taxation tapped by both governments to finance personal tax cuts, increased family benefits, higher pensions, greater education spending and much more during the past 16 years. No wonder the budget is in deficit.
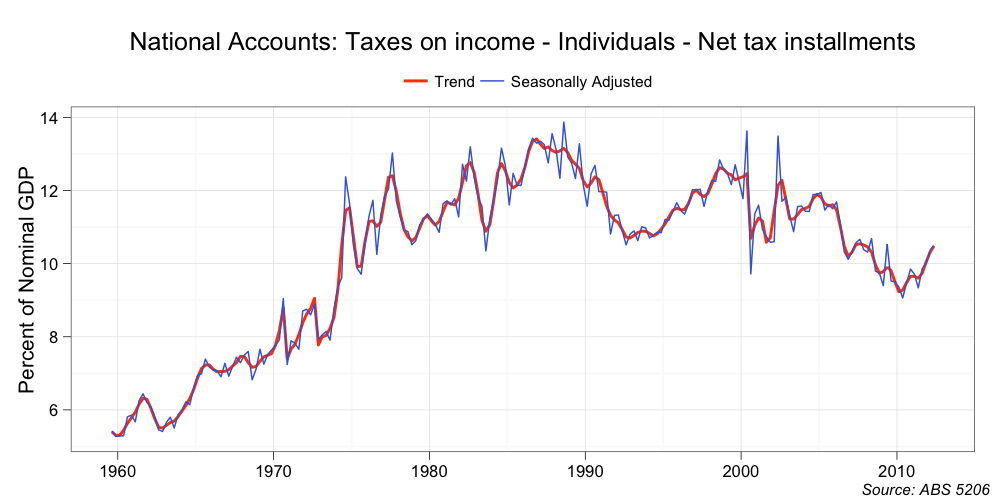
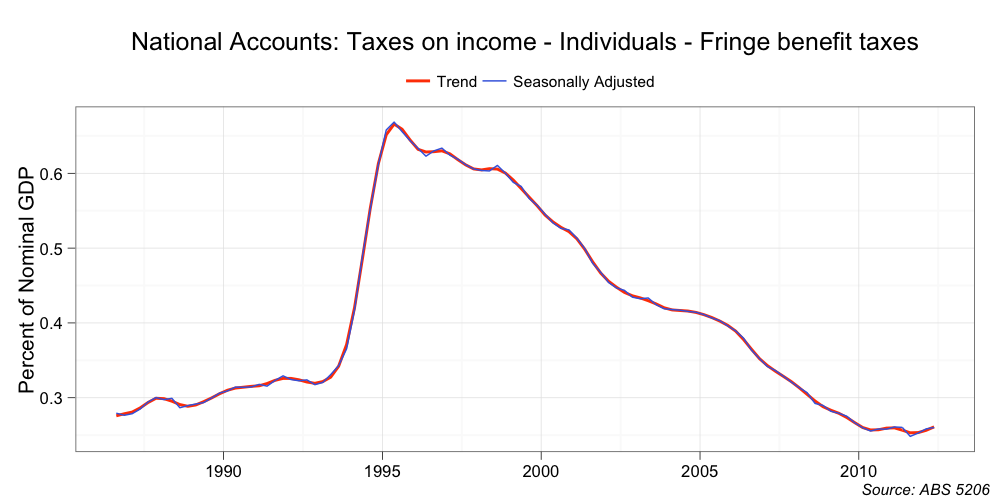
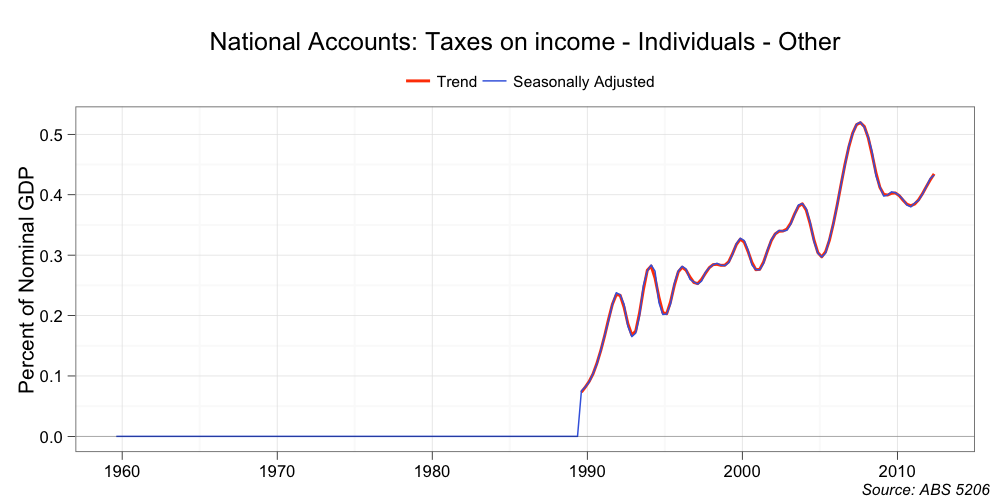
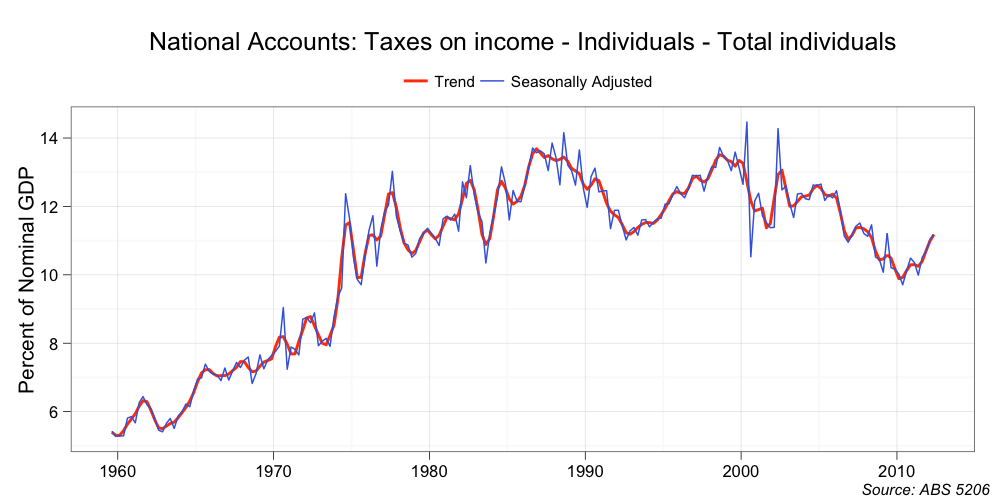
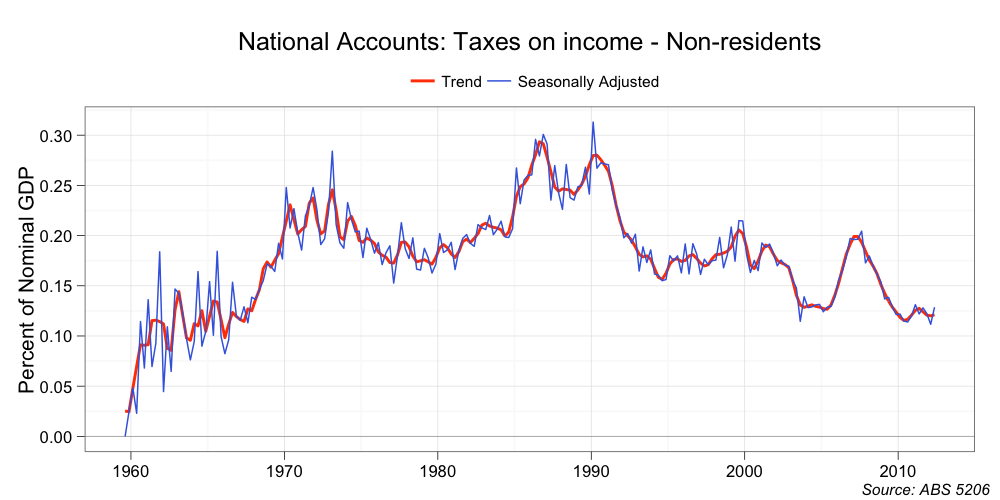
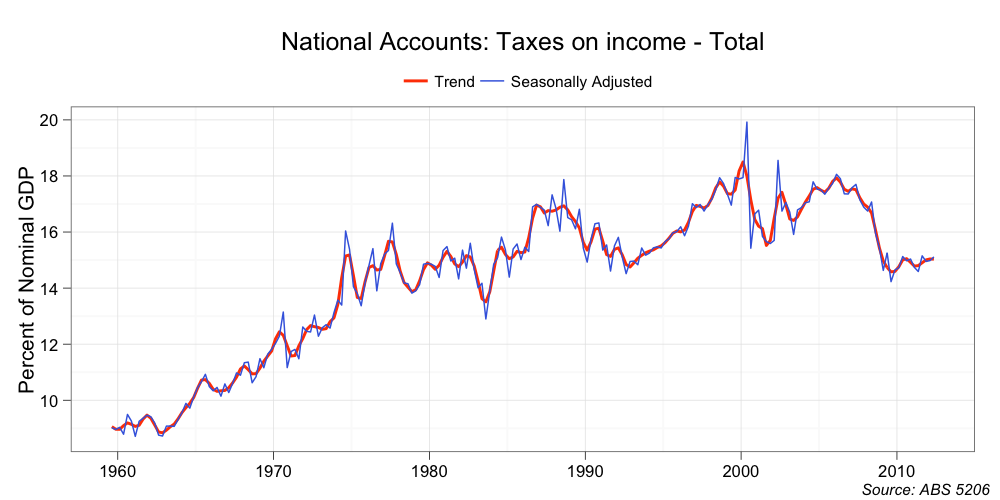
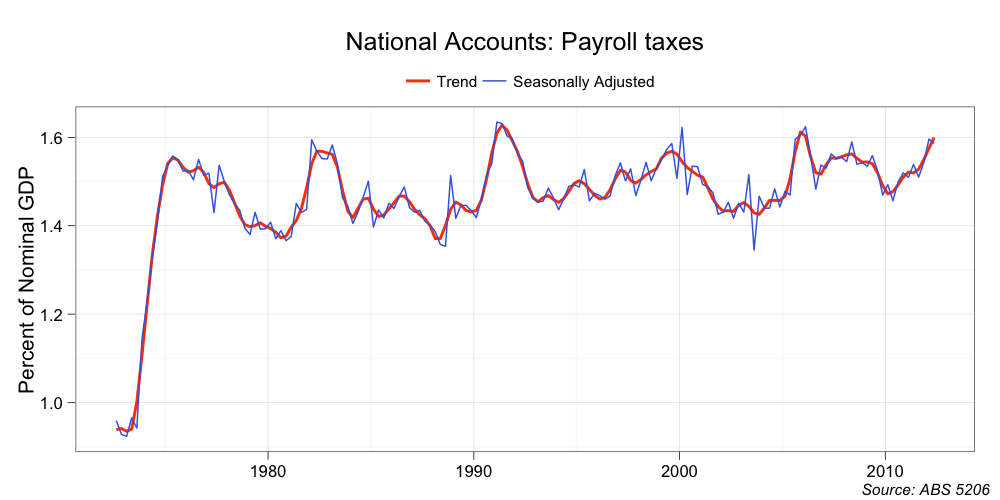
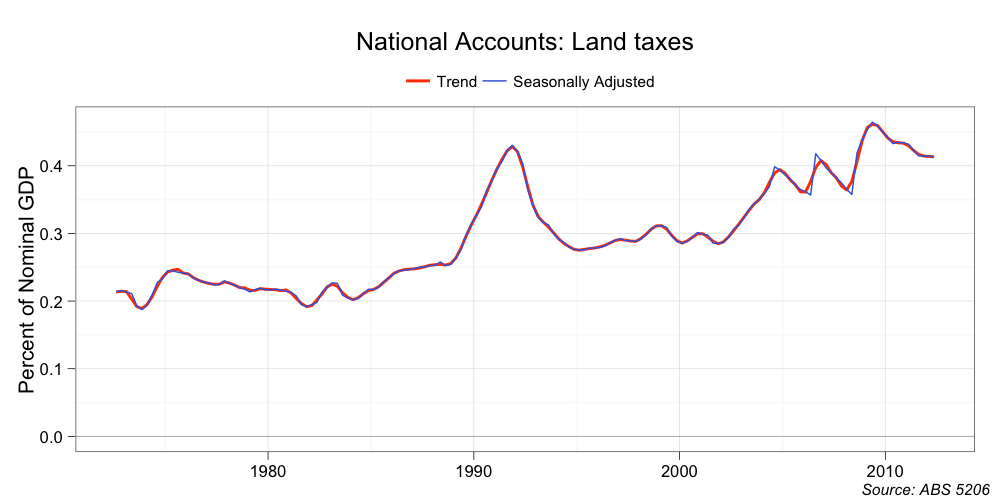
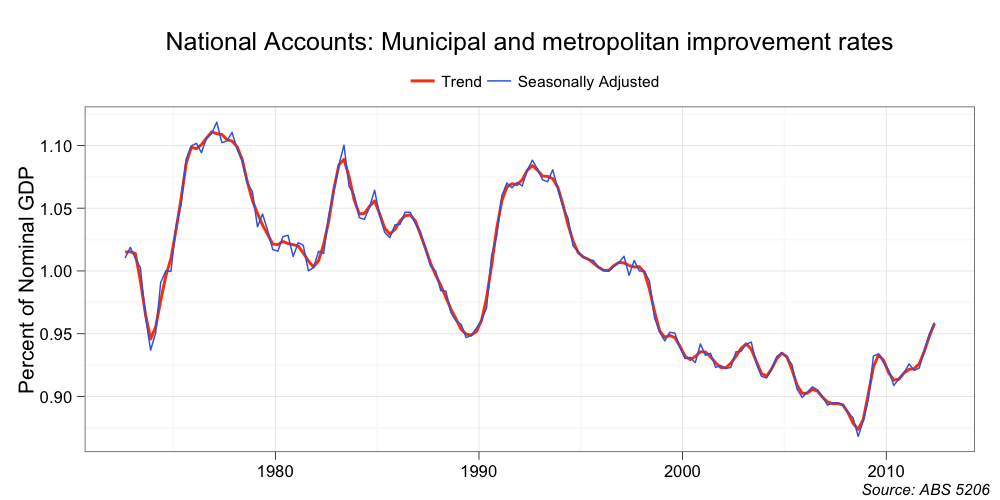
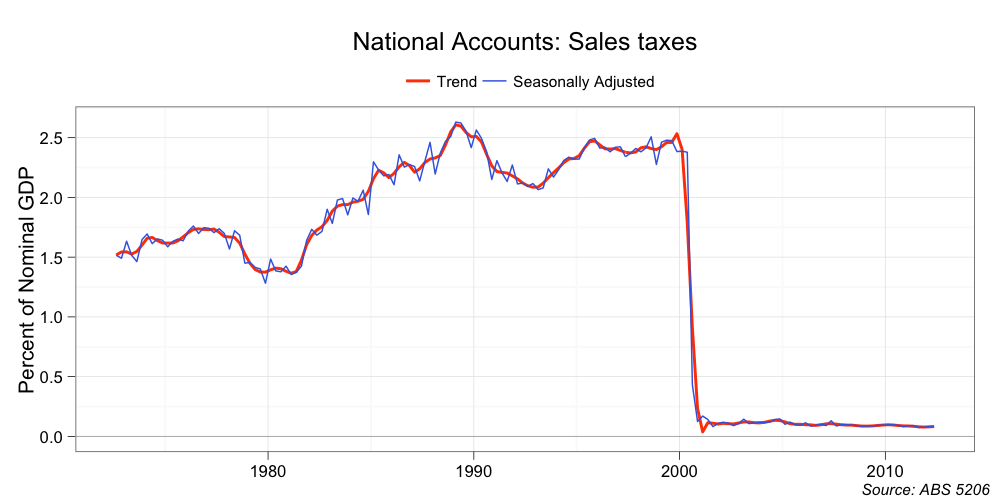
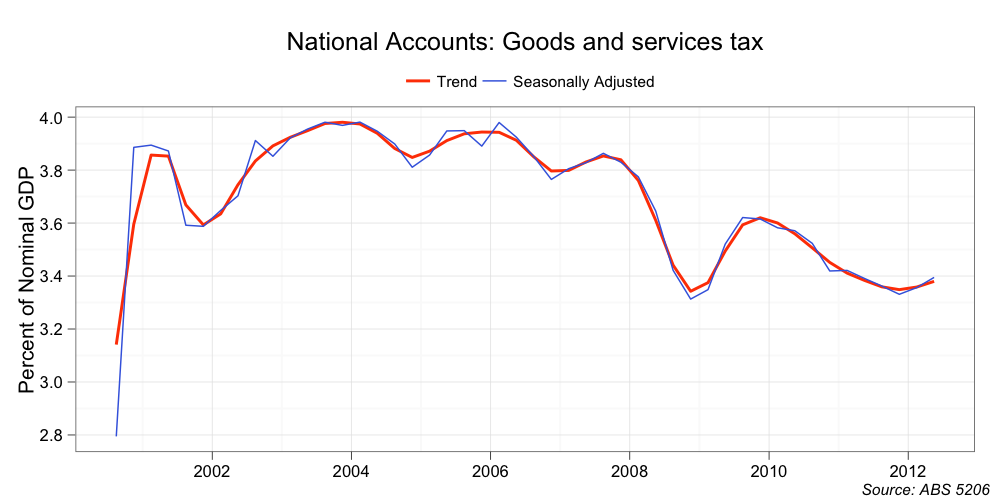
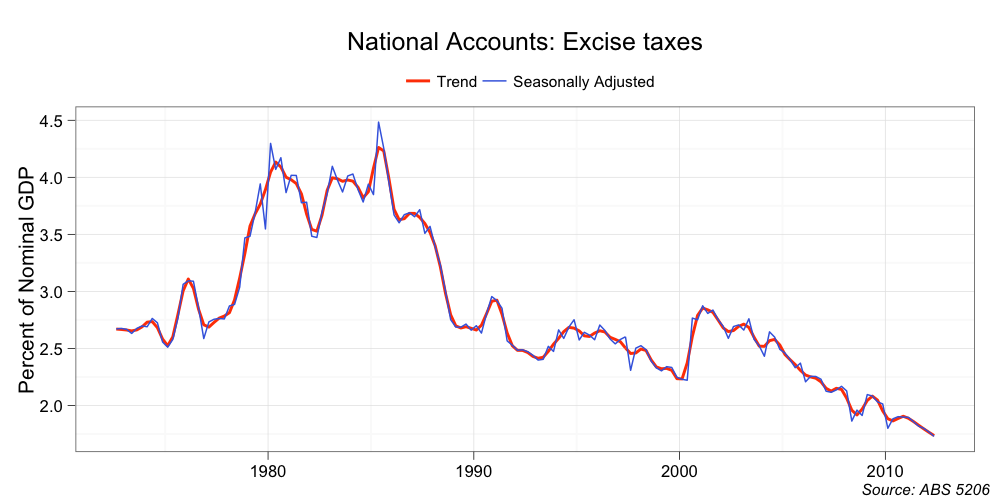
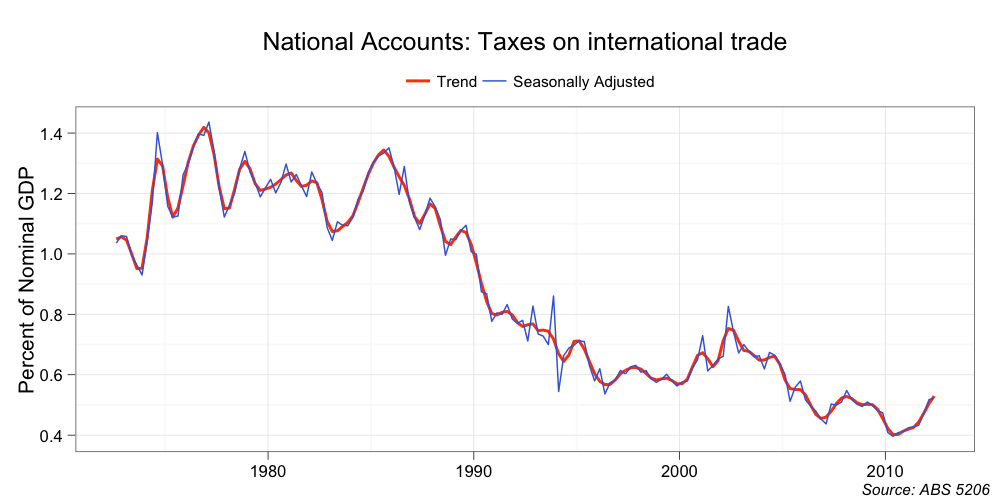
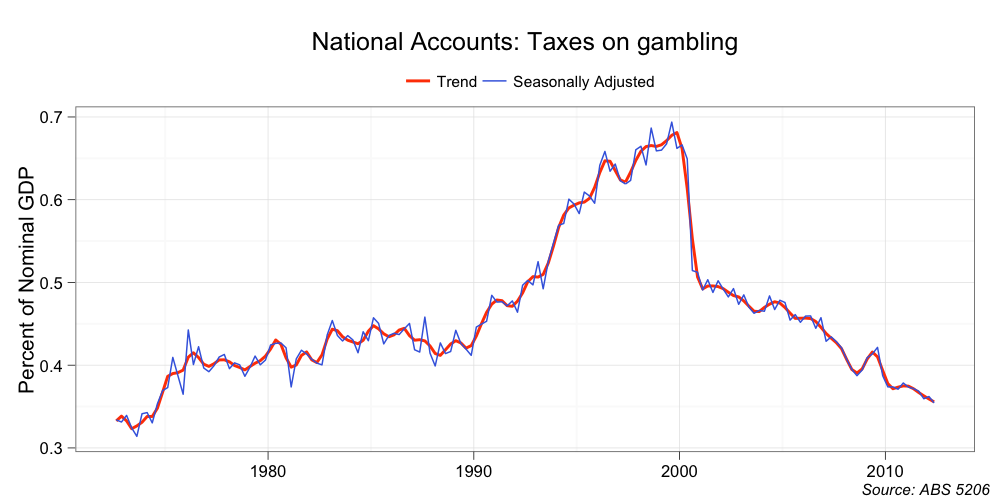
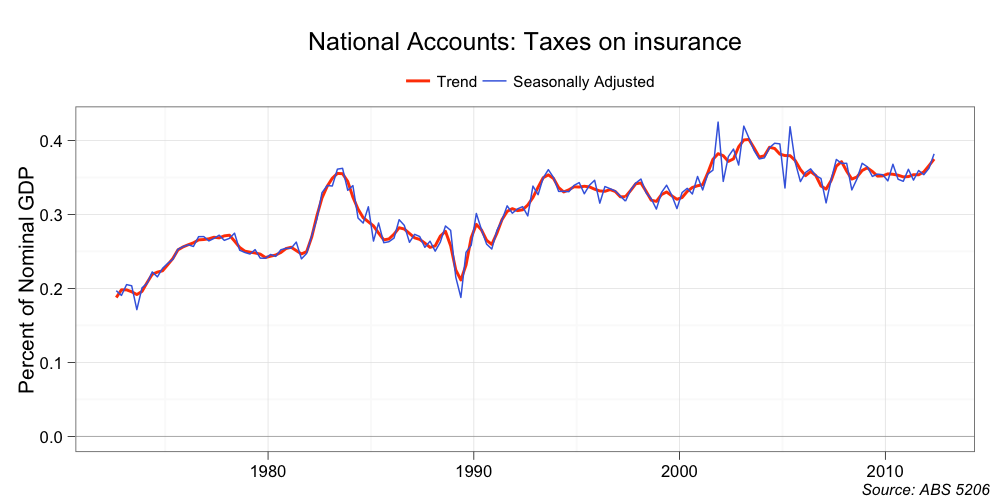
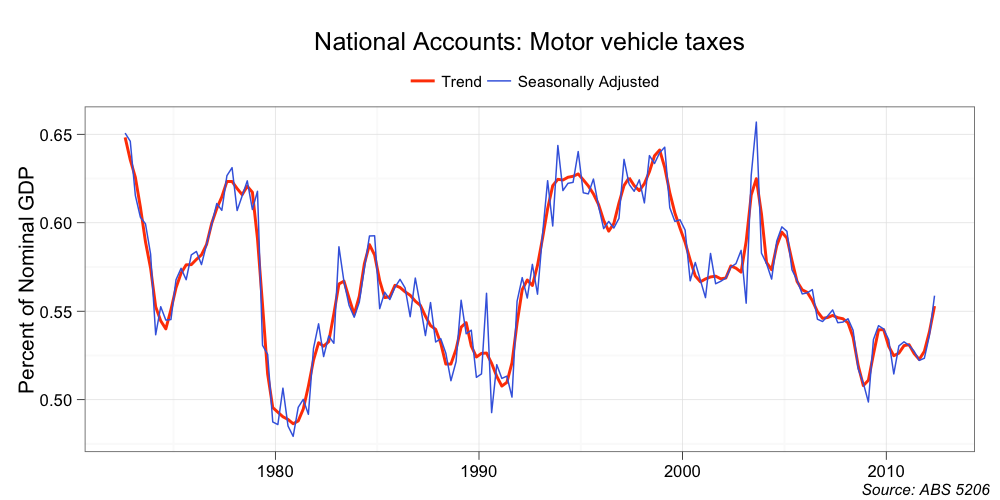
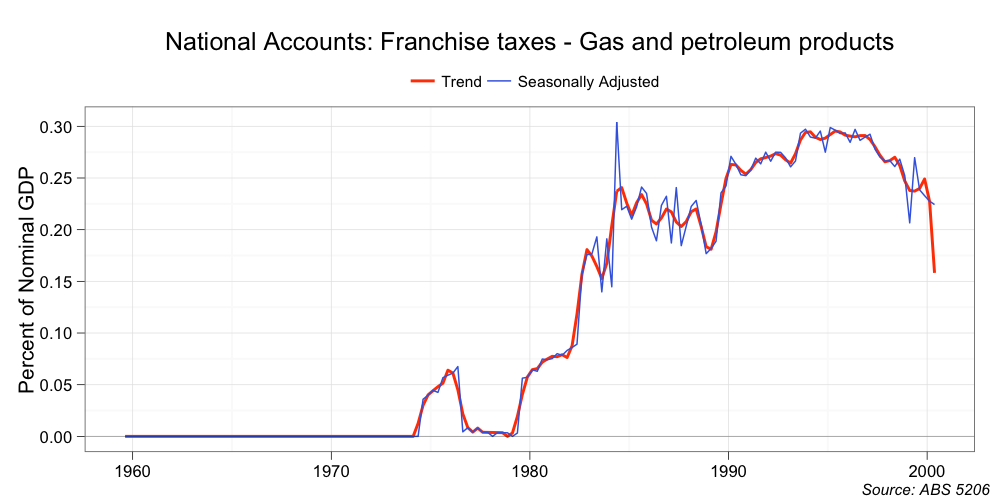
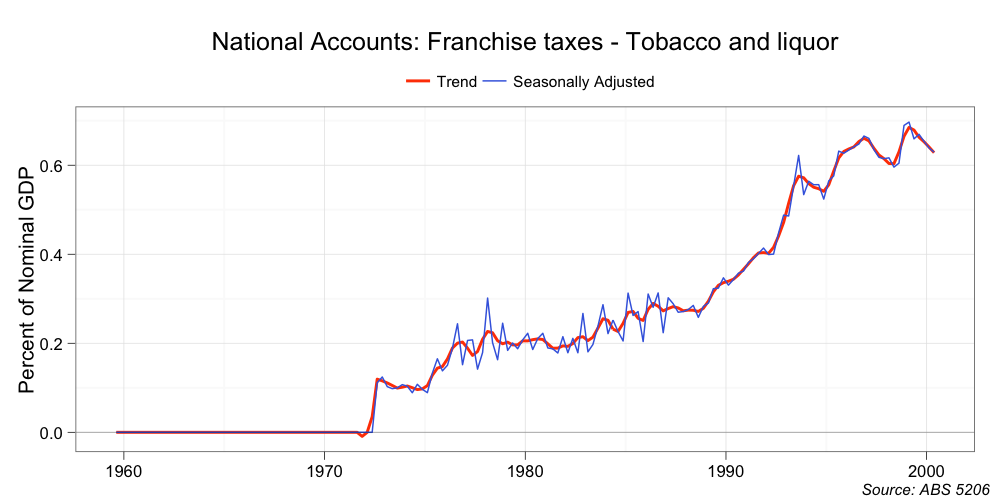
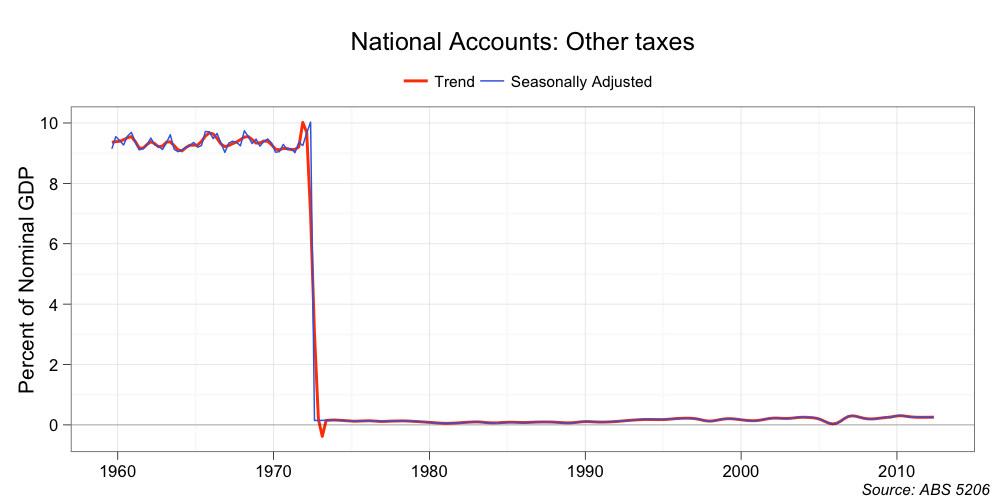
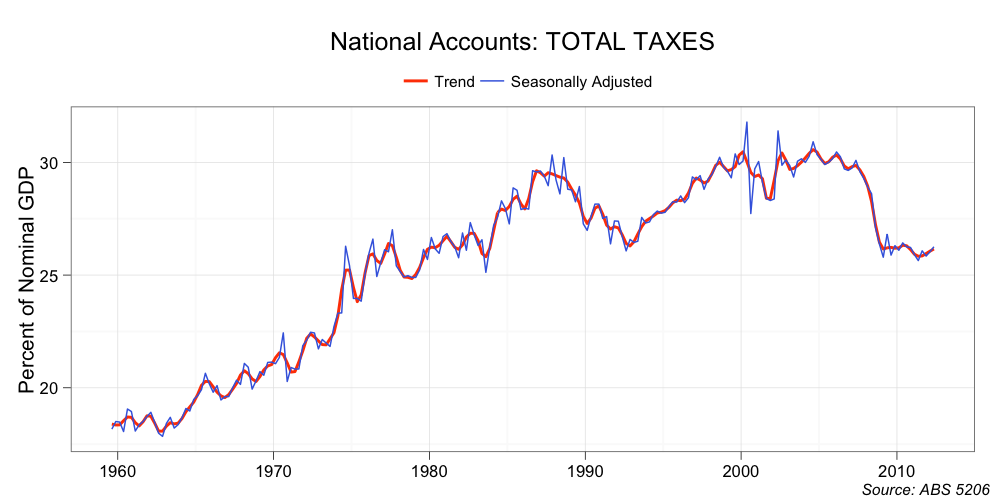
For completeness, attached are a set of charts from table 18 in the National Accounts, with the tax take presented as a proportion of nominal GDP for the quarter. Enjoy!