
Cross posted from Colin Twigg’s blog with permission:
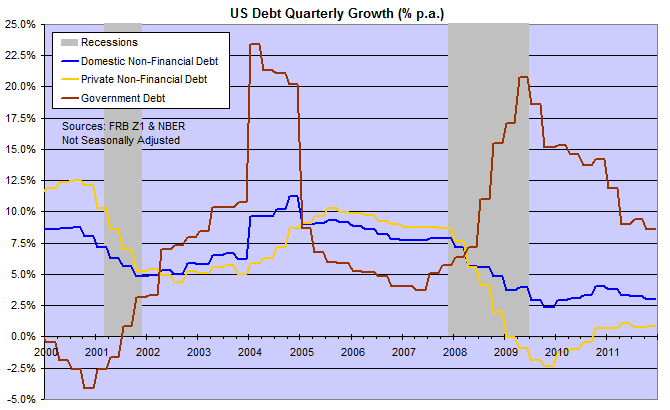
We often blame Fed monetary policy for the GFC, with interest rates at exceptionally low levels leading to “Greenspan’s bubble.” Treasury was just as culpable, however, with the massive 2004-2005 surge in public debt flooding the market with liquidity. The repeat in 2008-2011 was more justifiable: the spike in public debt was necessary to offset the sharp decline in private (non-financial) debt which would have caused a deflationary spiral. The effect was to smooth out the fall in total domestic debt (public and private) and create a relatively “soft” landing for the economy.
Quick Glossary
- Domestic debt is all local debt, both government and private sector
- Non-financial excludes the financial sector from debt calculations as it largely acts as a conduit for other sectors.
- Government debt includes federal, state and local government borrowing
- Private debt is all Domestic debt other than Government. It includes both Corporate and Household debt.
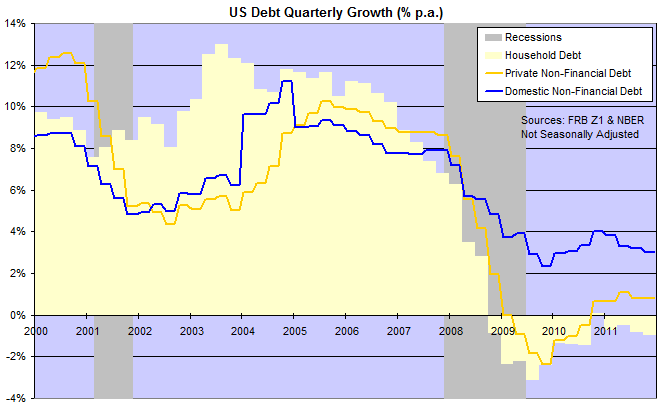
- Household debt is all debt owed by private households, as opposed to the corporate sector.
- GDP is the market value of all final (excludes intermediate) goods and services produced within a country in a given year/quarter.
- Nominal means before adjustment for inflation.
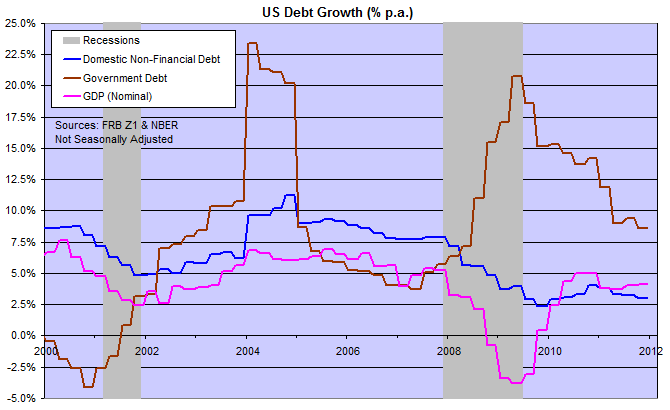
Public debt growth is slowing but needs to fall further in order to keep the economy on a sustainable path. A rough rule of thumb is that public debt should grow no faster than GDP — so that it does not outgrow the nation’s ability to repay. With public debt growing at 8.6% and GDP at a nominal rate of 4.1%, Treasury’s ability to repay — and its credit rating — is deteriorating. Reduction of public debt growth to a rate of no higher than 4.1% is necessary. Increases in tax collections as a percentage of GDP would alter this basic equation, but are highly unpopular and act as a disincentive to further GDP growth.
It should be evident from the above chart that GDP contracts when the rate of domestic debt growth slows. If domestic debt ever had to contract (below zero growth), you can imagine the impact that it would have on GDP. That is a debt-deflation spiral and should be avoided at all costs. So, although we would all like to see a sharp reduction in debt levels, there are limitations on how quickly this can be achieved — without smashing the economy into a brick wall.
We can also see that GDP growth for the past decade has been largely debt-fueled. Only recently has GDP growth surged above the growth rate of domestic debt, reflecting an increase in productivity. That is what we (not just the US) have to strive for: to widen the positive gap between GDP and domestic debt growth, while bringing public debt growth below the nominal rate of growth in GDP.
Reducing the rate of growth in public debt will not be easy, however, with private debt growing at a miserly 0.8% compared to domestic debt at 3.0%. The difference is made up by government debt, growing at a whopping 8.6%. Private capital expenditure, however, has in many cases been brought-forward to take advantage of accelerated tax write-offs and is likely to slow in the months ahead. Even worse is household debt which is contracting at an annual rate of 0.9%. So the medium-term outlook for private debt may be near-zero growth. And further slowing of public debt growth would court another recession.
Disclosure: Colin Twiggs is the owner of Incredible Charts, the charting software I use for my investing and trading business.