
Further to Houses and Holes’ earlier update on this morning’s release of the Australian Bureau of Statistics (ABS) retail trade data, please find below some charts summarising the current state of play in retailing.
First, below is a chart summarising the monthly, annual and quarterly growth rates by industry on a seasonally adjusted basis:
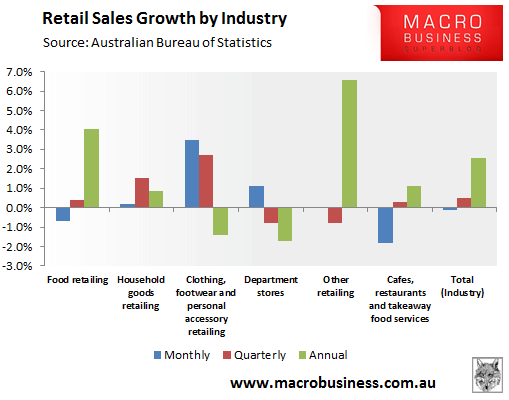
As you can see, it’s a mixed bag, with ‘food’ and ‘other’ retailing growing solidly over the year but poorly in December. By contrast, ‘clothing footwear & personal accessories’ sales grew solidly over the past quarter but actually contracted over the year.
Overall, retail sales grew at 2.6% over the year – around the rate of inflation – but actually contracted slightly in December.
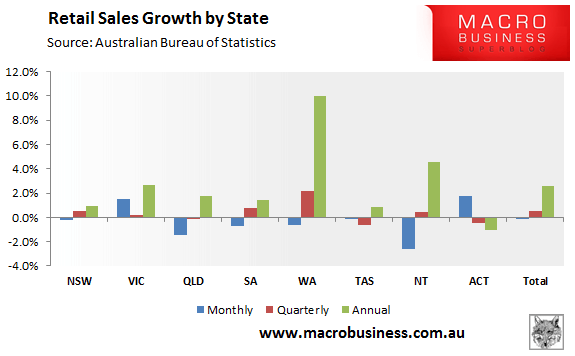
At the state level,Western Australia has clearly dominated over the year (but contracted in December), whereas retail sales in New South Wales have remained anaemic:
The trends are similar when sales are measured in chain volume terms, with ‘other retailing’ performing the best over the year (but poorly over the most recent quarter), and ‘clothing footwear & personal accessories’ sales growing solidly over the past quarter but contracting heavily over the year. Household goods retailing has also performed reasonably well on both a quarterly and annual basis:
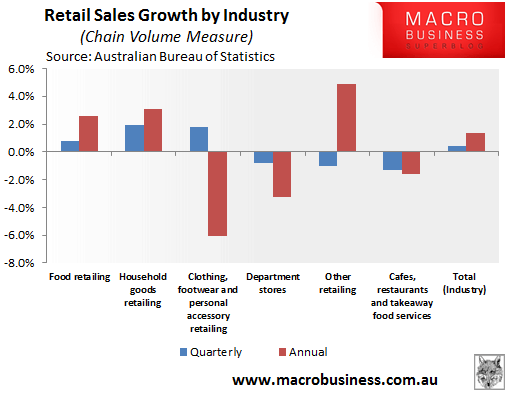
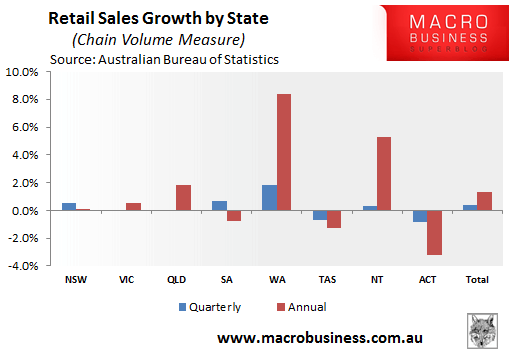
However, overall annual retail sales have grown at only 1.4% in chain volume terms, which is well below the 25-year average of nearly 4%.
At the state level it’s more of the same, with Western Australia dominating retail sales and the other states – particularly New South Wales, Victoria and South Australia – struggling:
The below chart shows the growth of retail sales by sector in chain volume terms since 1998:
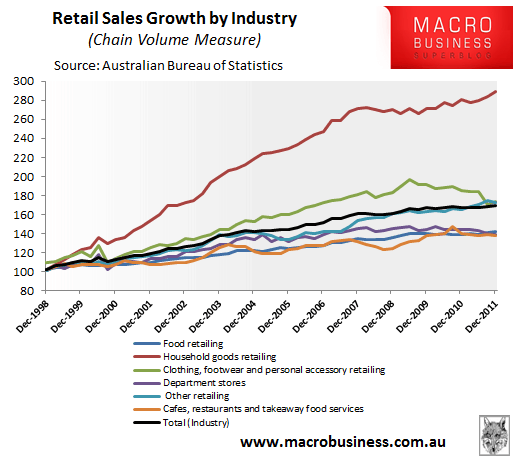
Mirroring the strong growth of Australian house prices over this period, ‘household goods retailing’ has been by far the star performer.
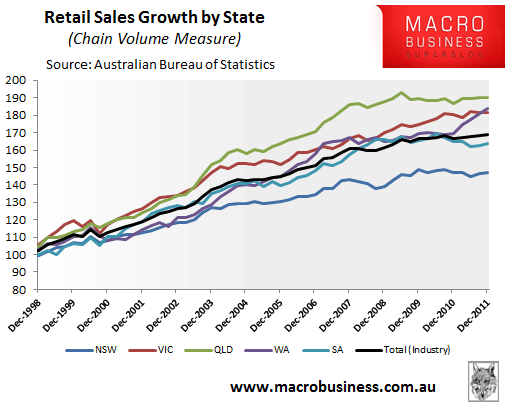
At the state level, you can see Western Australia’s out-performance more recently, and New South Wales’ under-performance over the period:
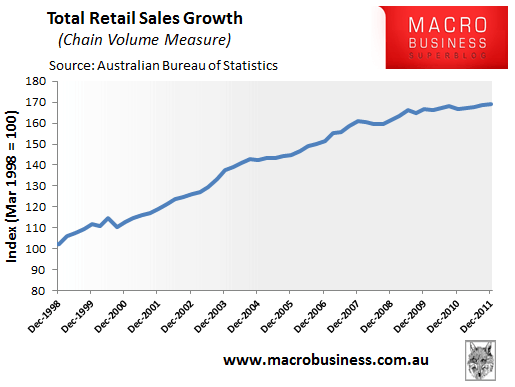
Overall, retail sales growth has clearly decelerated in chain volume terms, after solid growth to 2007:
The situation is even worse when sales volumes are adjusted for population growth. As shown by the below chart, retail sales have essentially been flat in real per capita terms since June 2007. This compares to the decade prior to 2007, when they were up 41%, or 3.5% per annum on average.
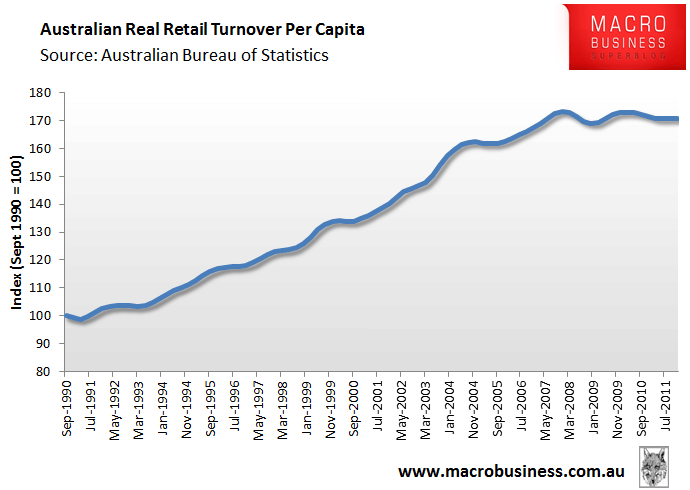
With household credit growth running near 34-year lows as Australians dis-leverage, combined with the negative wealth effect permeating from falling house prices, expect retail turnover to remain subdued, with further job losses likely.
unconventionaleconomist@hotmail.com
