
Today’s National Accounts show a very respectable 0.8% GDP growth over the September quarter, or a 2.1% gain of the year.
You might think I am being a little conservative, reporting the trend estimate, rather than the more commonly reported seasonally adjusted estimate. But with the scale of volatility in the data, I see no other way of monitoring the trajectory of economic activity. Not only do we need to look closely at the divergence of performance across States, we need to do our best to look through the volatility to the trends.
Take Western Australia as one example. The chart below shows the seasonably adjusted and trend estimates for private fixed capital formation (private sector capital expenditure). The investment boom is clearly yet to move into the export boom phase – we should expect this to occur with at least a two year delay.
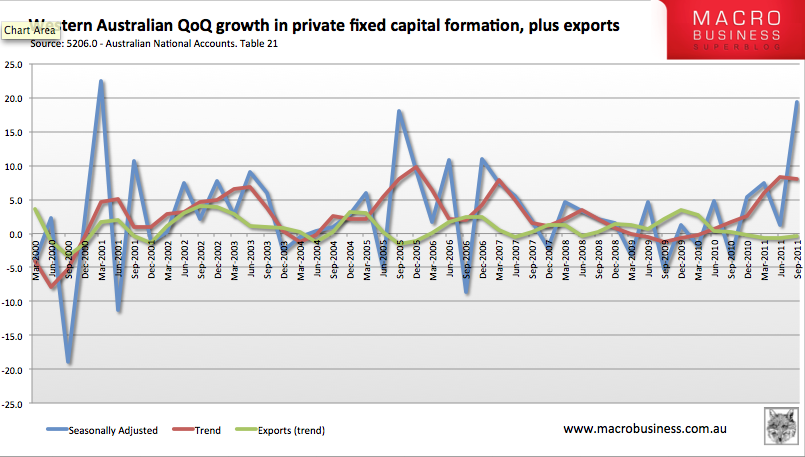
Seasonally adjusted we see a quarter-on-quarter growth of 19.4%, up from 1.3% last quarter. Clearly this is a product of the interaction between accounting periods and measurement methods. The trend estimate shows a much more realistic picture of a surge in investment since early 2010 which may, or may not, have peaked. Of course, if the trend growth rate begins to fall, it is still positive and indicating ongoing growth in private capital investment.
In the other resource state, Queensland, the trend and seasonally adjusted estimates are more closely aligned, with the trend measure at 8.6%, down from 9.5% in the June quarter, and seasonally adjusted at 9.7%, down from 12.6% in the June quarter.
As Houses & Holes noted earlier, the variation between States is historically high. But there is more to the story than the aggregate measure of State final demand (which incidentally, is the main input into the Gross State Product measure, needing only adjustments for net exports and change in inventories).
It would also be valuable to dig further to estimate changes in per capita measures. National GDP per capita growth averaged 2.3%pa over the decade prior to the financial crisis, and just 0.06% in the three years since. We often ignore this important measure, and with significant resource sector driven investment interstate migration (including fly-in, fly-out workers) the imbalances may be partly migration driven.
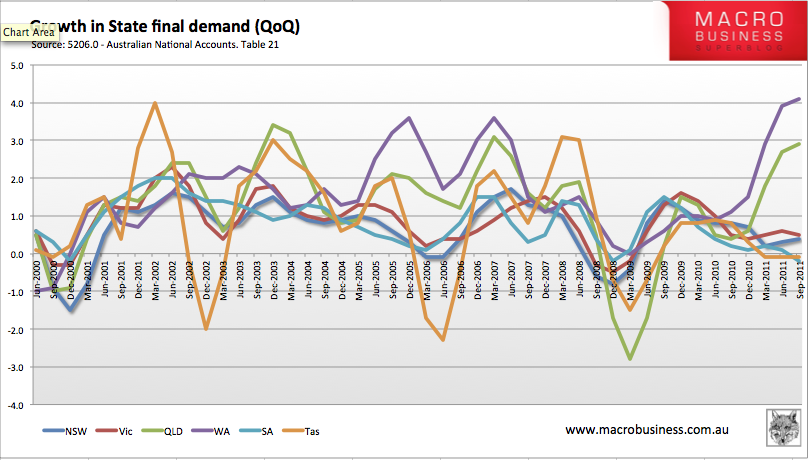
To decipher the underlying drivers of economic activity, we may as well first present trend estimates of State variation in final demand a little more clearly. Apart from Tasmania being much more variable (as you would expect from the smaller population and higher measurement error), the break out of Queensland and Western Australia is even more prominent that the last comparable period, around 2006.
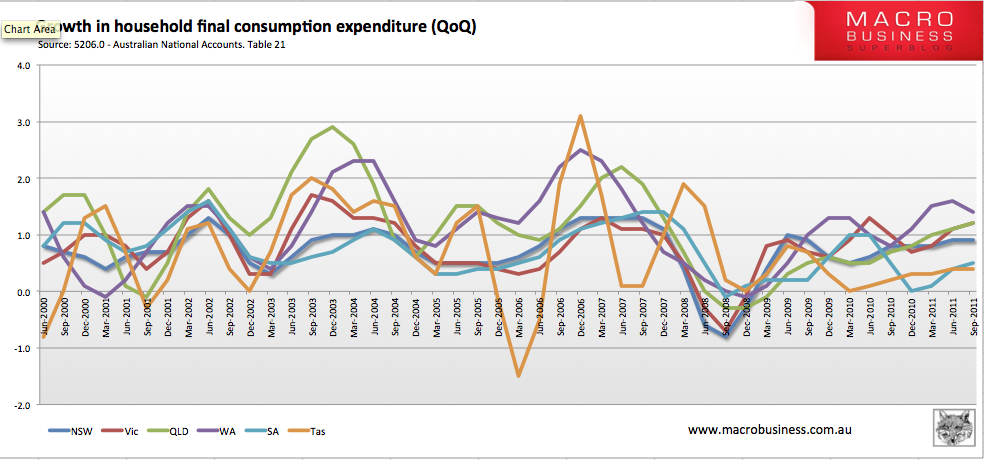
We can also examine whether households are reigning in their spending as much as retail trends suggest. Below we can see that growth in household final consumption appears to be increasing in all States, with Victoria surprisingly keeping pace with the resource states. The post-GFC period has seen stable positive growth rates, but significantly below the rates of growth seen in the early part of the 2000s.
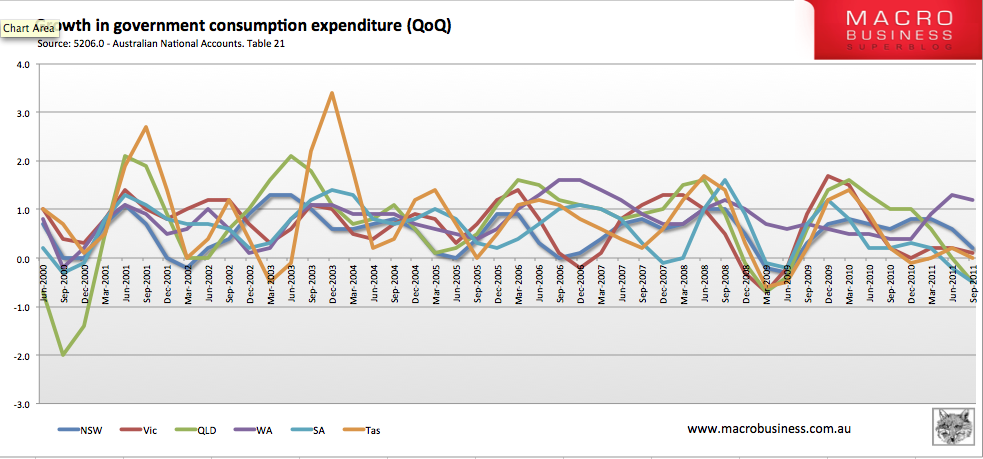
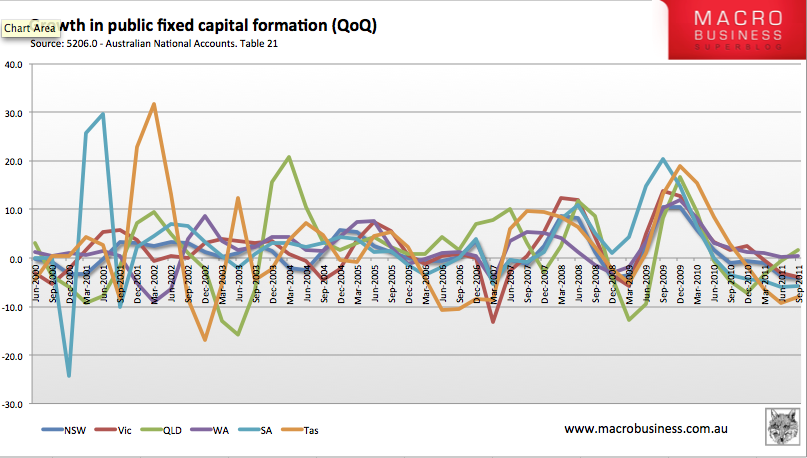
With budget surpluses the main game in Australian politics, one would expect that public final demand, and public fixed capital formation (capital investment) would be seeing falling, or negative growth rates. This trend is clearly borne out in the national accounts, with contraction (or close to it) of the public sector occurring in all states, apart from Western Australia.
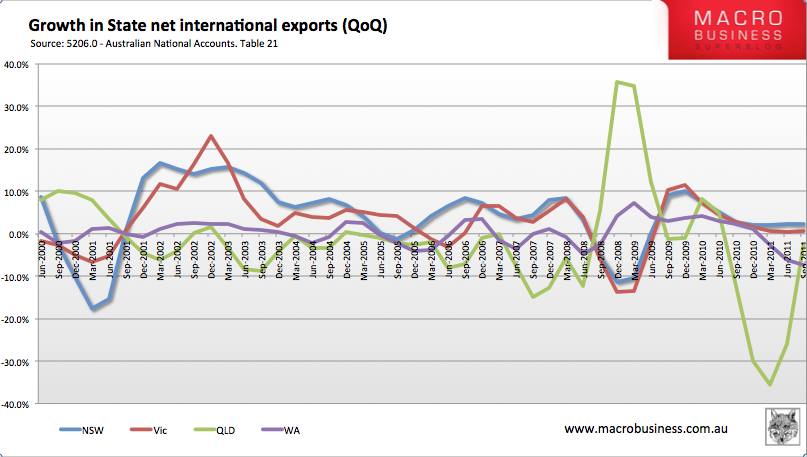
We can examine the changes to State net exports. These show some surprising results, with Western Australia strongly negative, and Queensland recovering from a partly flood related plunge earlier in the year. Victoria and New South Wales remain in positive growth territory.
Lucky last is the private fixed capital formation, showing the resource investment led growth in Western Australia and Queensland light years ahead of the other states.
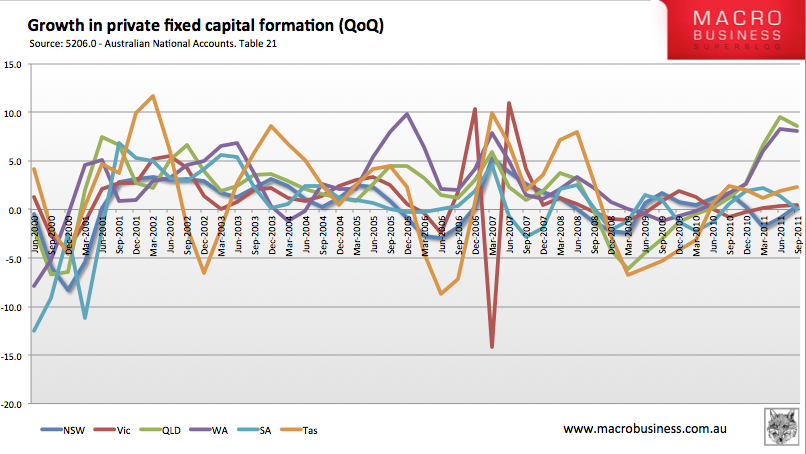
Overall, resource investment activity is clearly having a strong impact of stimulating economic activity in resource states, but there is much more to the picture.
Tips, suggestions, comments and requests to rumplestatskin@gmail.com + follow me on Twitter @rumplestatskin