
Some peculiar analysis has been circulating about whether the budgeted government fiscal position for 2011-12 is contractionary or expansionary. For example, Adam Carr remarked last week-
…the fiscal balance largely comes from an expected $72 billion lift, or rather surge, in revenues over fiscal 2012 and 2013. It is this jump in revenue that accounts for the decline in the fiscal balance from 3.3 per cent of GDP to a small surplus of 0.3 per cent. It’s fairly misleading to then suggest this is a fiscal contraction
…
The bottom line is that there is no real fiscal contraction underway in Australia – this is a misnomer and cannot be used to justify lower rates. Slower government spending growth does not detract from GDP. It may mean that government makes less of a contribution to growth, that’s true enough, but at a time that private demand is adding more, we will barely notice the difference.
If you are too busy or impatient to read on, simply remember that the above quote is a complete misinterpretation of the facts. It’s wrong. It’s a myth. For those reading on, here’s why.
First, if you want to examine the economic impacts of the fiscal position of the government you need to consider all tiers – local, state and federal.
Second, you can’t consider one side of the equation in isolation, spending in Carr’s case, without considering the revenue side (taxation), which is, by definition, a decrease in private demand. You need to look at the net fiscal position (taxes less spending).
Third, you need to consider the change in the net fiscal position between time periods, rather than look statically at one period relative to a balanced budget benchmark.
Fourth, to fully understand the current fiscal environment you need to be aware of the important balance between private and public sector demand.
Let us consider these issues.
The below graph is from the latest federal budget. It shows the fiscal balance for the consolidated public sector combining budget positions for all levels of government. The wrong way to interpret this graph is the textbook way – when the blue line is above zero (net surplus) the government fiscal position is contractionary, and when negative, the position is expansionary. The right way is to examine the gradient of the line, which is the change in the fiscal position from one year to the next. When the gradient is positive, as it was from 2001-02 to 2004-05, the budget of the government sector as a whole is contractionary. When the gradient is negative, as has been since 2005, the budget is stimulatory. The expectation for 2011-12 is clearly for a significant government contraction (government demand will be a lower proportion of total demand next year compared to this year):
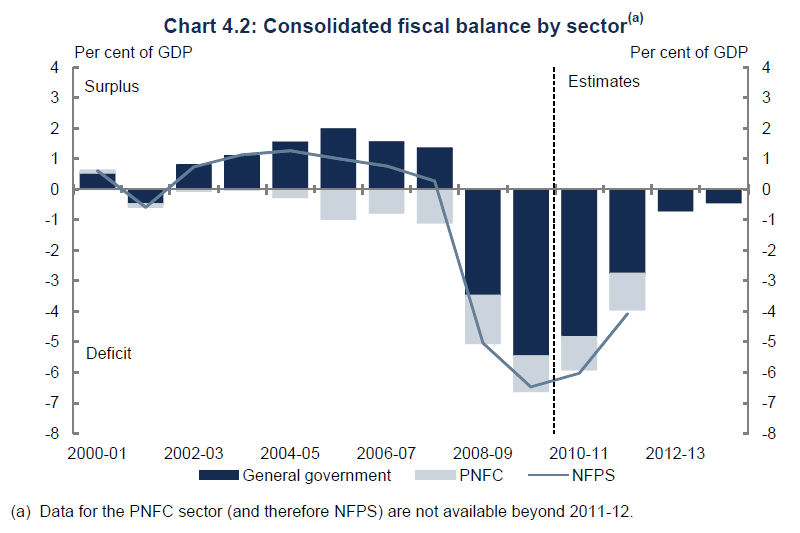
At the federal level the nominal value of spending will increase next year, but that alone is insufficient to claim that the budget is expansionary, because tax revenue will increase at a faster rate, subtracting more from private demand than will be injected by government spending. In 2010-11 the federal government injected $45billion more into the economy that it received in taxes, while in 2011-12 that net spending is expected to be down to $20billion.
In a slightly bizarre way, the fiscal positions at the State level are moving in the opposite direction to the fiscal position at the federal level. States are increasing their spending while the federal government is tightening its belt. The change in the budget position is down (stimulatory) in NSW ($2billion), Queensland ($1.7billion), Western Australia ($800million) and Victoria ($2billion). That is not a list of budget deficits for 2011-12, but a list of the INCREASE in the budget deficit from 2010-11 to 2011-12.
The budgeted federal contraction in spending more than offsets the State level expansions to leave the government sector as a whole injecting $20billion less into the economy in 2011-12 (or 2% of GDP).
So how does this government fiscal position fit in with the private sector credit environment?
Below is a chart of the growth rate of private sector credit since 1989. We can clearly see that there is a strong relationship between economic growth and credit creation in the private sector. But it is important to note the scale of the growth in private sector credit. In 2007 private sector demand increased by $219billion as a result of the new borrowing. In 2009 private sector credit growth was just $55billion or just one quarter of the 2007 level.
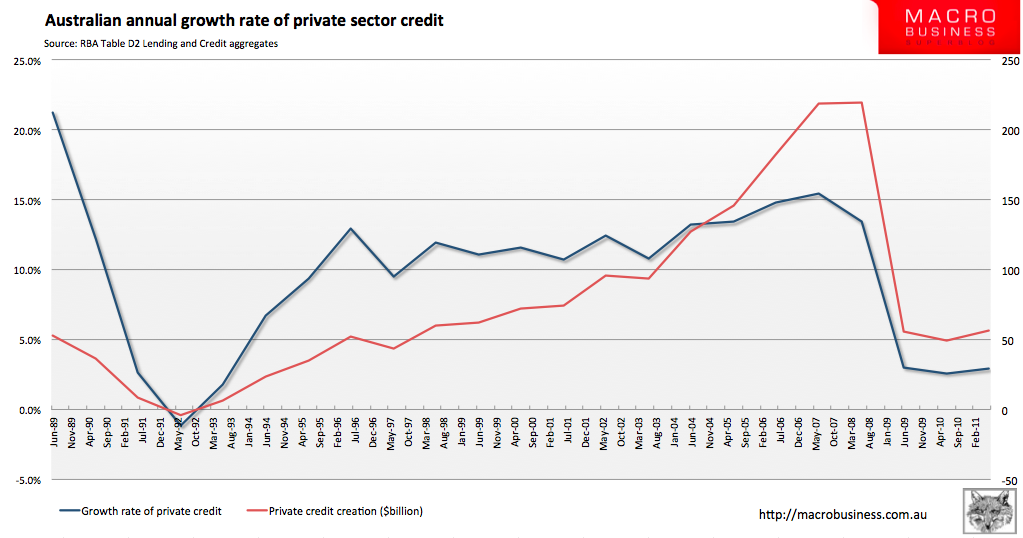
Private sector credit expanded by just $7.5billion in 2010-11, while government contracted its position by the same amount, leaving credit growth unchanged. If government plans to go much further and contract its position by $20billion in 2011-12, some serious private credit expansion wil be needed to maintain a growth environment, and looser monetary policy may be one way to acheieve this. Even if the private sector increases its credit beyond the government contraction under the current monetary setting, it will still be the lowest rate of credit growth seen since the recession of the early 1990s. So much for Carr’s throw away line – It may mean that government makes less of a contribution to growth, that’s true enough, but at a time that private demand is adding more, we will barely notice the difference. I’d say that graph above clearly shows private demand is at recessionary levels and that government contraction will make a difference to economic growth and employment conditions.
While the budgeted fiscal contraction may not eventuate due to unfolding economic circumstances, it is definitely a factor at play to be considered in setting monetary policy. To look at just one side of the equation, the spending side, and trumpet the idea that government is not contracting is simply false.
Tips, suggestions, comments and requests to rumplestatskin@gmail.com + follow me on Twitter @rumplestatskin