
The S&P/ASX 200 Index closed up 52 points or 1.2% higher to 4346 points today, probably on the back of the news that we had seen the back of Italian Prime Minister Silvio Berlusconi. In after hours trading, the index has given back some of these gains and is down 15 points, with Euro and US markets are pointing to modest opens.
Asian markets had a good day, with Japan’s Nikkei 225 up 0.8% to 8726 points, the Hang Seng up 1.6% at 20011 and the Shanghai Composite currently up 0.2% to 2508 points.
In other risk assets, the AUD slipped 0.3% to 1.0363 against the USD whilst WTI crude gained slightly, now at $97.07 USD a barrel.
Gold lost 0.5% during the Asian session after a steady London/NYMEX session overnight and is currently at $1790 USD an ounce or $1726 AUD an ounce.
Movers and Shakers
A green day on the board of the ASX, with almost all sectors up, REIT and materials the standouts, with telecomms (i.e Telstra) the only loser.
The banks were all good, with ANZ up 0.8%, Commonwealth (CBA) up 0.56%, National Australia Bank (NAB) up 1.3% whilst Westpac (WBC) put on 1.3%
Macquarie (MQG) jumped nearly 3%, whilst healthcare stalwart Cochlear (COH) built on yesterday’s gains and was up 1.3% at the close. Its “twin” CSL gained 0.5% whilst Telstra (TLS), the only bluechip down for the day, lost 0.6%
BHP Billiton (BHP) was up strongly, now approaching $40 a share rising 1.5%, whilst Rio Tinto (RIO) put on 1.4%, gold miner Newcrest Mining (NCM) up 2.2%, Fortescue (FMG) having another “quiet” day, only up 1.6% and Woodside Petroleum (WPL) up 1.3%
Woolworths (WOW) continues to bounce back from its 3 year low and put on another 0.7% to finish at $24.80 per share.
The Charts
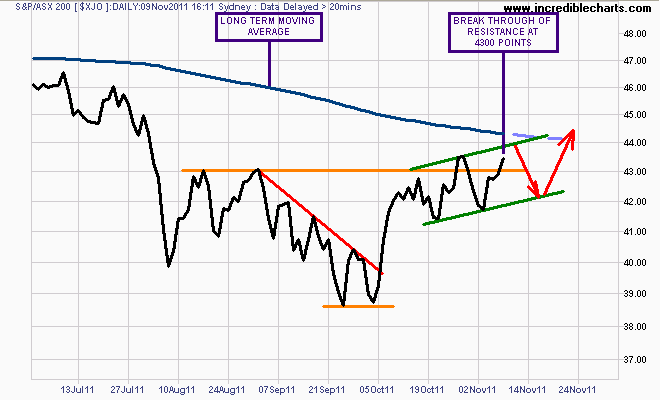
Today’s action by breaking through the 4300 point resistance level has confirmed an intermediate uptrend. The short term chart has formed a bullish flag pattern, which could retrace to as low as 4200 points before continuing on to the “congestion area” of 4400 points and above.
The daily price action is part of a medium term price pattern formed around the October extreme lows (a double bottom), with an inverse head and shoulders pattern formed since the sudden early August crack in the market. We are now at the right hand shoulder of this pattern (with the sloping red line the “neckline”):
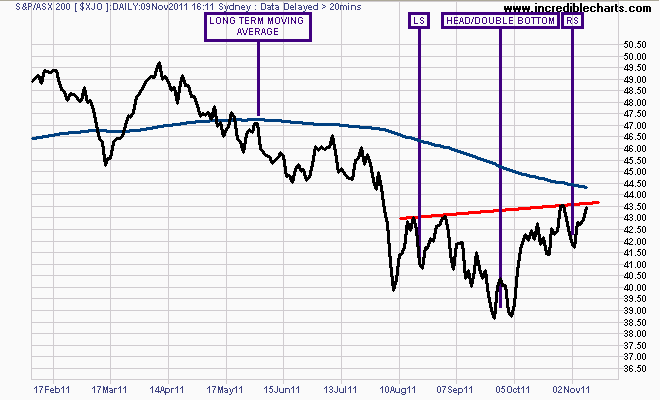
This is a bullish reversal pattern in the medium term (for a few months) and will likely take the market back to its pre-August high around 4500-4600 points, probably on a breakout above 4350, with the proviso that it must clear the long term moving average and resistance at 4450 points in the next few weeks.
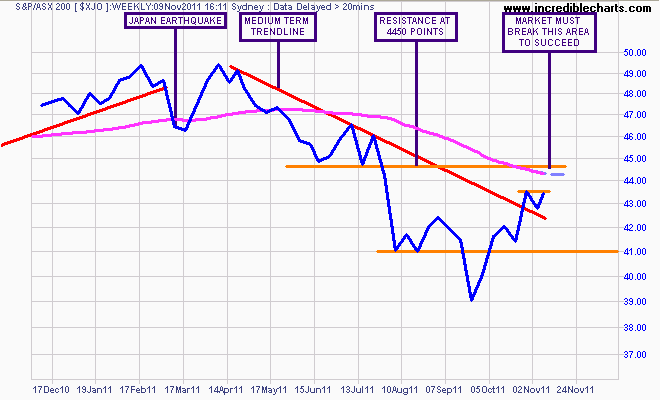
This can be clearly seen in the weekly chart of the ASX200 below where the market has bounced up to the 4350 area twice:
Now before you reach for your phone to call your broker, I have cautioned before that this is a “Tom Jones” bear market rally. It is not unusual, nor special (apart from very high intraday volatility, particularly on the HFT “infected” bourses of the Northern Hemisphere).
The market is now up some 12.5% since the 3863 point closing low in late September, with a rally that has lasted 8 weeks. History shows that a typical bear market rally lasts approx. 8-12 weeks and has a typical magnitude of 15-20% before resuming a downtrend.
Suffice to say that the removal of the suave Italian PM (you’ve got to admit, he’s got style) has not assuaged the macro outlook, but sentiment can move all risk markets higher for the time being. Tread carefully and assign your asset allocation based on the risks, not pie-in-the-sky returns.
Watch my “Chart of the Day” posts for continued analysis of US, Euro and Asian markets which will lead the way.