
The S&P/ASX 200 Index closed up 20 points or 0.48% higher to 4293 points today. In after hours trading, the index has given back on these gains and is down 20 points, with Euro and US markets are pointing to slightly lower or steady opens.
Asian markets had a mixed day, with Japan’s Nikkei 225 down 1.2% at 8663 points, the Hang Seng up 0.4% at 19753 and the Shanghai Composite currently steady at 2513 points.
In other risk assets, the AUD fell over half a percent to 1.0317 against the USD whilst WTI crude slipped slightly, now at $95.37 USD a barrel.
Gold was steady during the Asian session after rising strongly in the London/NYMEX session overnight and is currently at $1792 USD an ounce or $1737 AUD an ounce.
Movers and Shakers
A generally good day on the ASX, with most sectors up, only consumer stocks and IT sectors down.
The banks were all good, with ANZ up 1.8%, Commonwealth (CBA) up 0.7%, National Australia Bank (NAB) up 1% whilst Westpac (WBC) put on 0.8% after going ex-dividend yesterday.
Macquarie (MQG) slid nearly 0.4%, whilst healthcare stalwart Cochlear (COH) finally had an up day, closing at $52 a share after gaining over 0.5% today. Its “twin” CSL gained 0.8% whilst Telstra (TLS) was bid up slightly to $3.15 a share.
BHP Billiton (BHP) was steady, whilst Rio Tinto (RIO) put on 1.4%, gold miner Newcrest Mining (NCM) up 1%, Fortescue (FMG) having a quiet day, only up nearly 3% and Woodside Petroleum (WPL) up 0.3%
Woolworths (WOW) continues to bounce back from its 3 year low and put on another 0.5% to finish at $24.60 per share.
The Charts
Today’s action almost confirmed an intermediate uptrend, as the market peaked above the 4300 resistance level (4301.5 was the intraday high). The short term chart is forming a bullish flag pattern, but this could easily morph into a bearish head and shoulders, particularly on a retracement to the 4200 level.
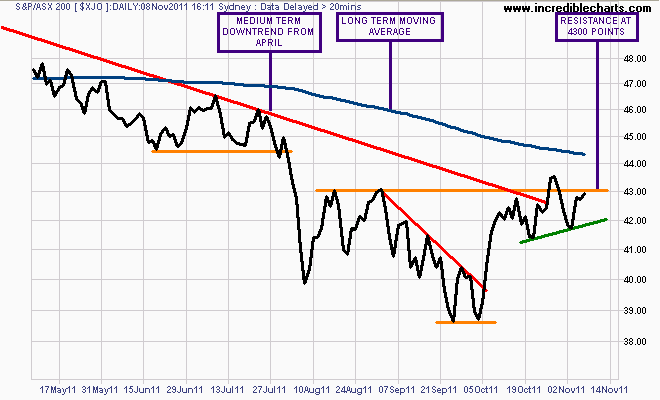
This level remains key but there are some headwinds for the Aussie bourse, first and foremost the Shanghai Composite Index (SSEC)
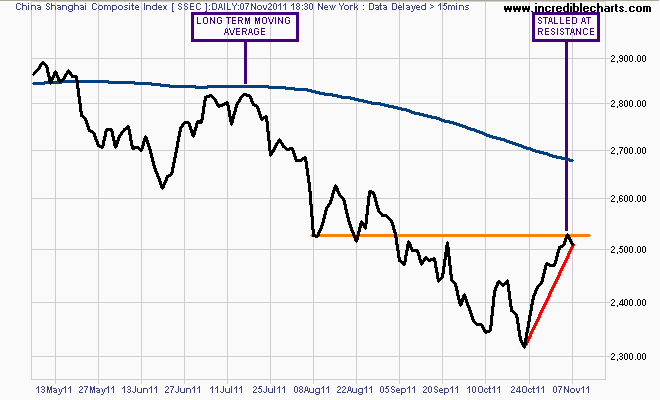
As the chart above shows, the SSEC has stalled from its recent rally – which was pushed by the financial sector, as explained here by Data Diary.
The SSEC is in a long bear market, still some 60% down from its 2007 high and faces the same technical uphill battle as the ASX200, as it too is well below its long term moving average and recent high.
The only bullish drag is the US, now going through Q3 earnings season as I explained on this morning’s Chart of the Day. All eyes remain on Europe.
Watch my “Chart of the Day” posts for continued analysis of US, Euro and Asian markets which will lead the way.