
An interesting day on the S&P/ASX 200 Index, closing down 7 points or 0.18% lower to 4272 points after being down more than half a percent all day. In after hours trading, the index is steady, with Euro and US markets are pointing to slightly higher or steady opens.
Asian markets experienced similar losses, with Japan’s Nikkei 225 down 0.4% at 8764 points, the Hang Seng steady at 19826 and the Shanghai Composite currently down some 0.5% to 2514 points.
In other risk assets, the AUD fell slightly to 1.036 against the USD whilst WTI crude rose slightly, now at $94.55 USD a barrel.
Gold put on nearly 1% during the Asian session and is currently at $1771 USD an ounce or $1708 AUD an ounce.
Movers and Shakers
A mixed day on the ASX, with the healthcare and industrial sectors up, financials and consumer sectors down. A standout however, was the IT sector – up over 10% on Computershare’s (CPU) after announcing a bolt on acquisition in the US, closing up nearly 16% for the day.
The banks were mixed, with ANZ up 0.8%, Commonwealth (CBA) up 0.6%, National Australia Bank (NAB) steady whilst Westpac (WBC) went ex-dividend and fell over 4%.
Macquarie (MQG) also went ex-dividend and fell 4%, whilst healthcare stalwart Cochlear (COH) continues to slide back, now below $52 a share after losing over 2% today. Its “twin” CSL gained 1.6% whilst Telstra (TLS) was bid up slightly to $3.14 a share.
BHP Billiton (BHP) slipped, down 0.7%, whilst Rio Tinto (RIO) lost 1.6%, gold miner Newcrest Mining (NCM) had another good day, rising 2%
Fortescue (FMG) finished the day down nearly 4% and Woodside Petroleum (WPL) was also down 1.5%
Woolworths (WOW) continues to bounce back from its 3 year low and put on nearly 1% to finish at $24.47 per share.
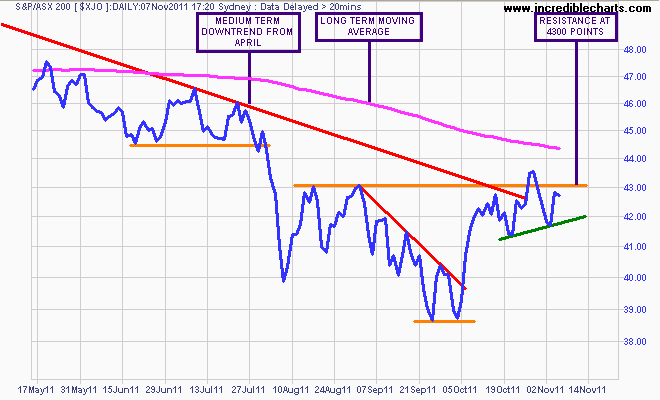
The Charts
Today’s very slight retracement has not affected the current short term uptrend (marked in green below), although the market still has not cleared resistance at 4300 points to morph into an into intermediate uptrend.
A break below short term support would likely complete a very short term head and shoulder pattern (the false breakout above 4300 points being the head) resulting in the resumption of the medium term downtrend from April.
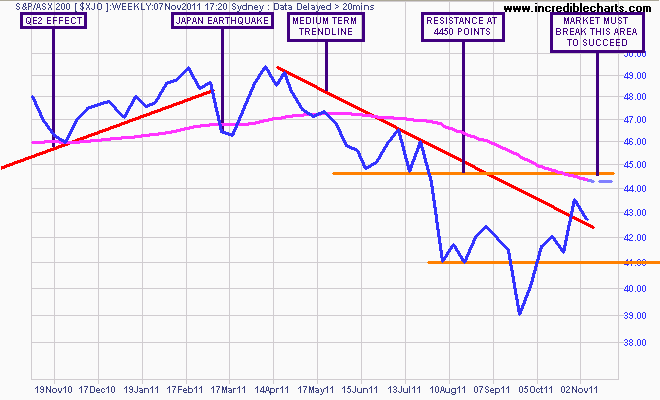
As seen on the weekly chart below, the market still needs to clear this overhead resistance and then the long term average at ca. 4450 for a sustained rally.
In addition, a weekly close below the dominant medium term downtrend will likely presage a correction to the 4100 support level with possible overshoot to the September 3800 low.
This remains a bear market and with earnings growth downgrades popping up from the AGM season, value traps remain.
Watch my “Chart of the Day” posts for continued analysis of US, Euro and Asian markets which will lead the way.