
A great chart from Dr Ed Yardeni’s blog on the US S&P500 earnings bonanza (note that the US reports quarterly, Australian corporates half yearly).
The chart is a weekly update of analyst’s average forecast of quarterly earnings. Note the substantial upward revisions to Q1 thru Q3, with an estimated looking through growth rate of some 16.3%. However, there are some danger signs ahead, most evident by the purple waterslide that is Q4 earnings estimates.
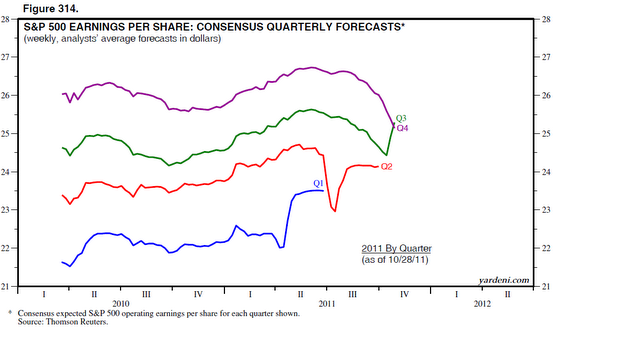
As Dr Yardeni spells out:
1. Q4 expectations continue to slide – analysts lowered their Q4 estimate for the thirteenth week in a row to slightly below the latest actual/estimated number for Q3
2. Expectations for 2012 are also on a slippery slope -The consensus for next year’s S&P 500 operating earnings fell to $108.45 at the end of October from a peak of $113.83 during the week of August 5.
Joe and I expect it will fall to $100 by the end of this year, and that it will be the actual outcome in 2012
What does this mean for Aussie investors? Note that our sharemarket is firmly coupled with the US, in terms of price movement and Price-Earnings ratios, regardless of the fact that our economies are totally different and our markets have completely different composition (the ASX200 should be renamed the ASX8 as I’ve explained before – residential housing investment trusts and primary resource extraction, vs. the advanced industrial companies that make up the US bourse)
The consensus of flat to declining earnings – i.e no real earnings growth – means a compression in P/E ratios which at best means a topping of US equity market valuations, which implies a similar dynamic down under.
Although Australian broker forecasts are currently running at 10-13% earnings growth for next year, with credit growth still anemic and terms of trade breaking down, it appears this too maybe a bridge too far even for the ASX8.