
Australian equity investors must always look abroad to the US to indicate the probabilities of future gains or losses on the ASX as binary risk markets continue to correlate (positively: equities, non-USD currencies, commodities; negatively: USD, USD bonds)to each other.
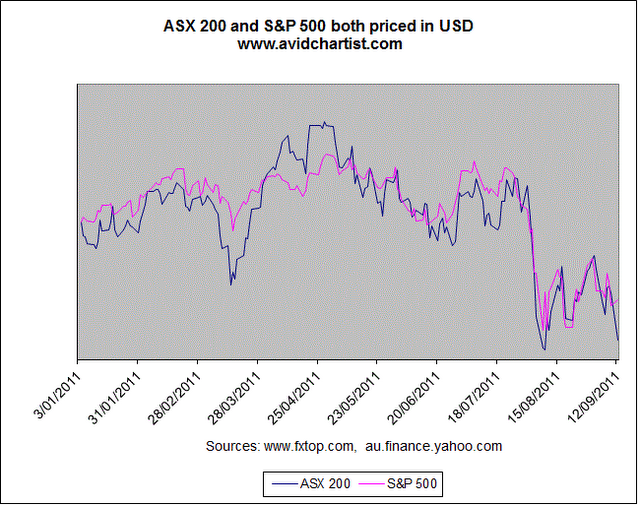
For those who don’t understand or don’t want to believe the impact of world finance on our own bourse, look at Avid Chartist’s recent (but soon to be updated) study of the ASX200 and the SP500, denominated in USD:
Which brings us to todays chart, which highlights these risks clearly, from a study done by Citigroup’s Tom Fitzpatrick (via ZeroHedge).
Setting aside the detailed secondary technical analysis contained within, this chart provides an analog to the October 2007 to May 2008 activity on the S&P500 Index:
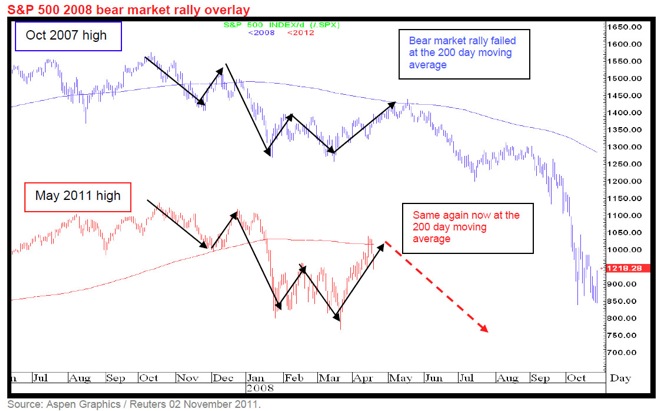
From the note comes this warning:
“While we respect the October monthly close on the S&P 500, we did not close above the 12 month moving average…we believe the bear market rally is behind us and anticipate a move towards the 1,000-1,015 target over the weeks and months ahead.”
That target bottom – some 20% below last night’s close – is equivalent to the correction to the 1220-1300 range on the S&P500 before the impact of the failure of Lehman Brothers in late September 2008, therefore is not a call for a repeat of the latter (an avoidable market crash that became a credit crunch), but an extension of a typical bear market, which seems more and more unavoidable day by day.