
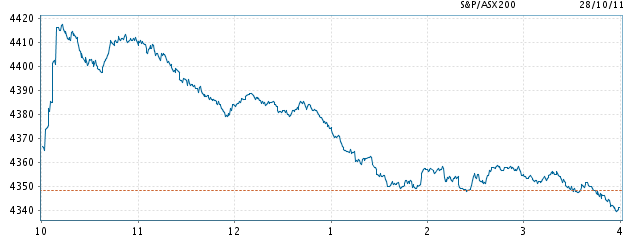
The S&P/ASX 200 Index closed 5 points or 0.1% higher to 4353 points after a very solid open was sold off during the day. In after hours trading, the index is steady, with Euro and US markets pointing to slightly lower or steady opens after the frivolity of last night.
Asian markets outperformed, with Japan’s Nikkei 225 up 1.4% at 9050 points, the Hang Seng up almost 2% to 20071. The Shanghai Composite also did well, bid up 1.55% to 2473 points.
In other risk assets, the AUD has jumped again, currently trading at 106.68 cents USD, whilst WTI crude slipped a little from its overnight jump, now at $93.51 USD a barrel.
Gold lost a little during the Asian session and is currently at $1738 USD an ounce or $1628 AUD an ounce.
Movers and Shakers
A mixed board on the ASX today, although the morning session was a good one, with IT the best sector up 2.1% and healthcare the worse, down 1.8%.
The banks finished in mixed territory, with ANZ up 0.4%, Commonwealth (CBA) steady, National Australia Bank (NAB) up 0.46% (WBC) down 0.35%.
Macquarie (MQG) outperformed climbing 3.3%, after announcing a 10% share buyback, using its dormant cash war chest as its pathetic Return on Equity (ROE) remains below a term deposit rate…
Cochlear (COH) slipped 0.4%, whilst its “twin” CSL fell almost 3%. Telstra (TLS) also took a hit, down 1.5% but it remains in an intermediate uptrend.
BHP Billiton (BHP) rose above $39 a share but came back and closed up 0.9% whilst Rio Tinto (RIO) was up 0.75%, gold miner Newcrest Mining (NCM) lost 2% as the price of gold in AUD continued to fall on AUD/USD strength.
Fortescue (FMG) eventually finished down 0.6% Woodside Petroleum (WPL) up just over half a percent.
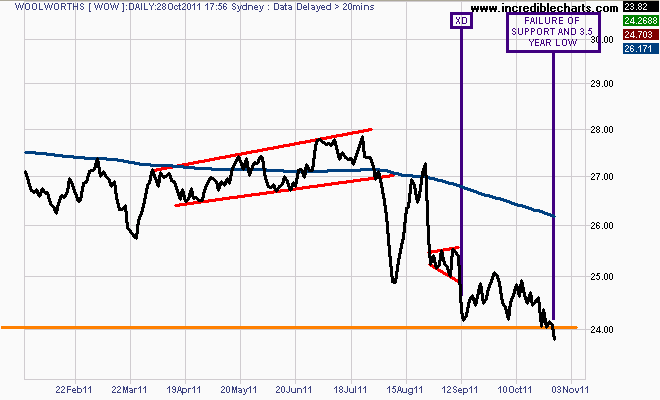
Woolworths (WOW) has continued to be sold off, down more than 1% below support at $24 a share and now at a 3.5 year low:
The Charts
I want to start today’s chart analysis with a quote from anti-hero Hugh Hendry:
Markets are irrational but they are right at every moment. They are right until they are wrong. You have to marry the notion of being right or wrong with being right with the timing of a given proposition.
Yesterday I explained that we are either seeing the start of a new bull market, the continuation of a bear market rally, or perhaps a trap. A bull trap.
Investing and trading is about dealing in probabilities, not certainties. Another anti-hero, George Soros said it best:
It doesn’t matter if you’re right or wrong, its how much you win when you’re right and how much you don’t lose when you’re wrong.
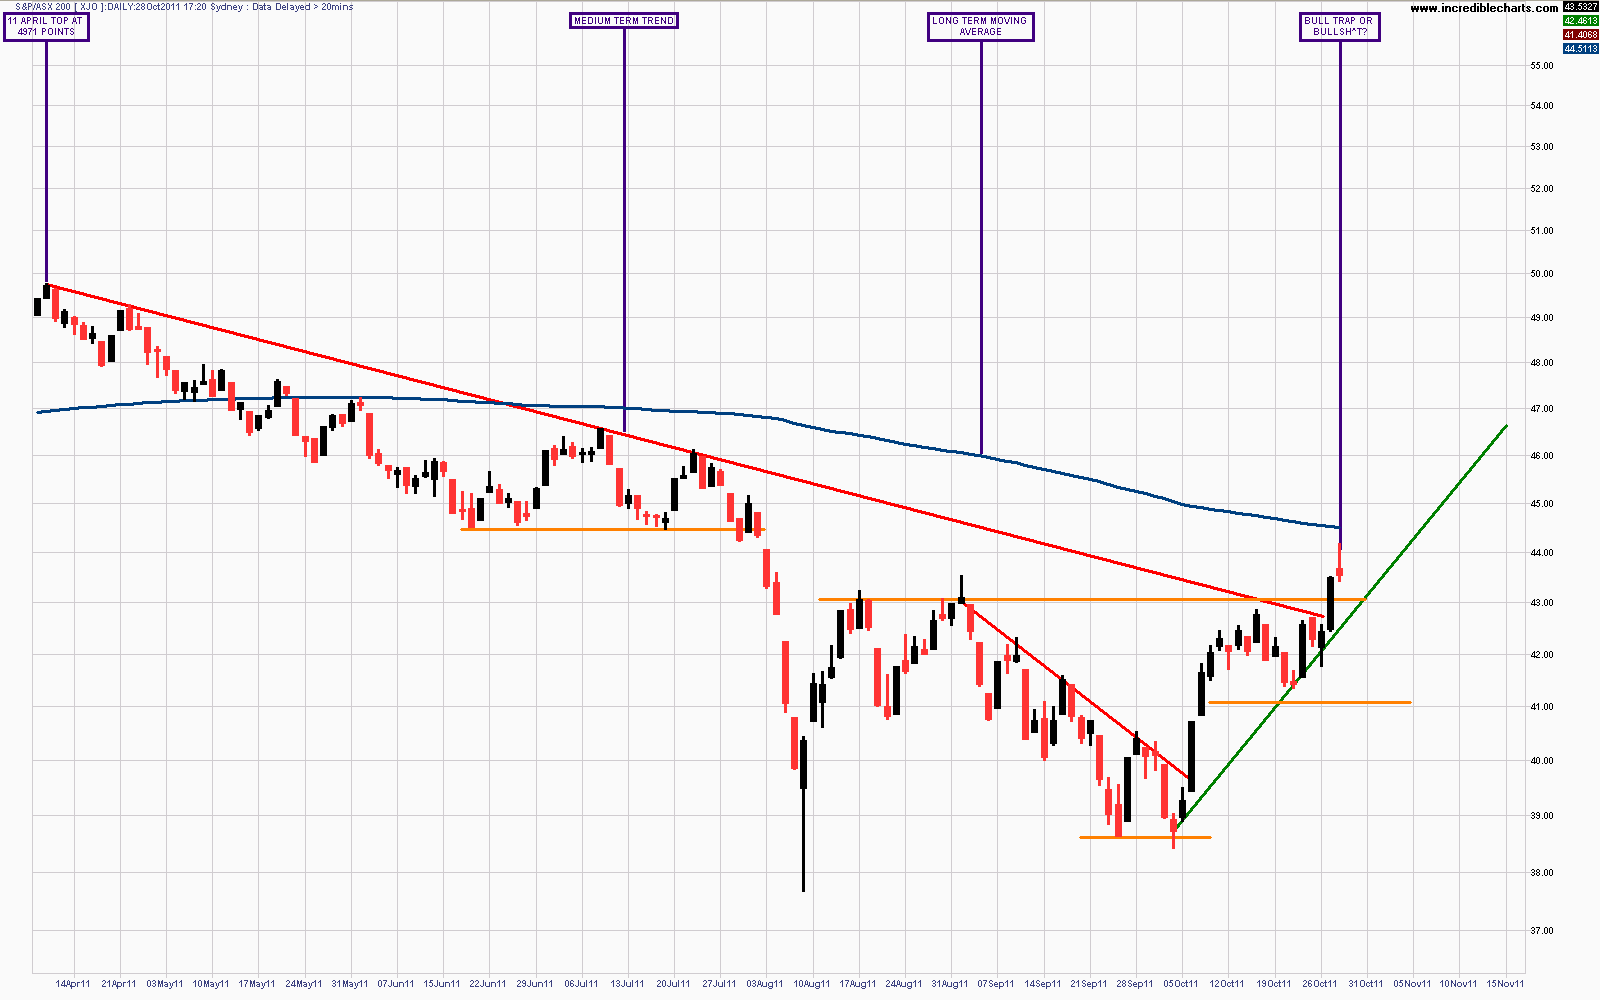
Enough with the philosophy, let’s look at the daily chart first:
Click to enlarge
Normally I would make this a full width chart, but it doesn’t capture the candlesticks properly and today’s looks like a classic bull trap. An opening gap, then a sell down, shown by the long tail above the daily candle.
As I said yesterday, the daily downtrend line (marked in red) from the April high has been broken, but this could be a false breakout. Given the severely overbought conditions in Euro and US equity markets – which we follow – caution abounds.
The springing of the trap would involve a failure to abide by the green uptrend line.
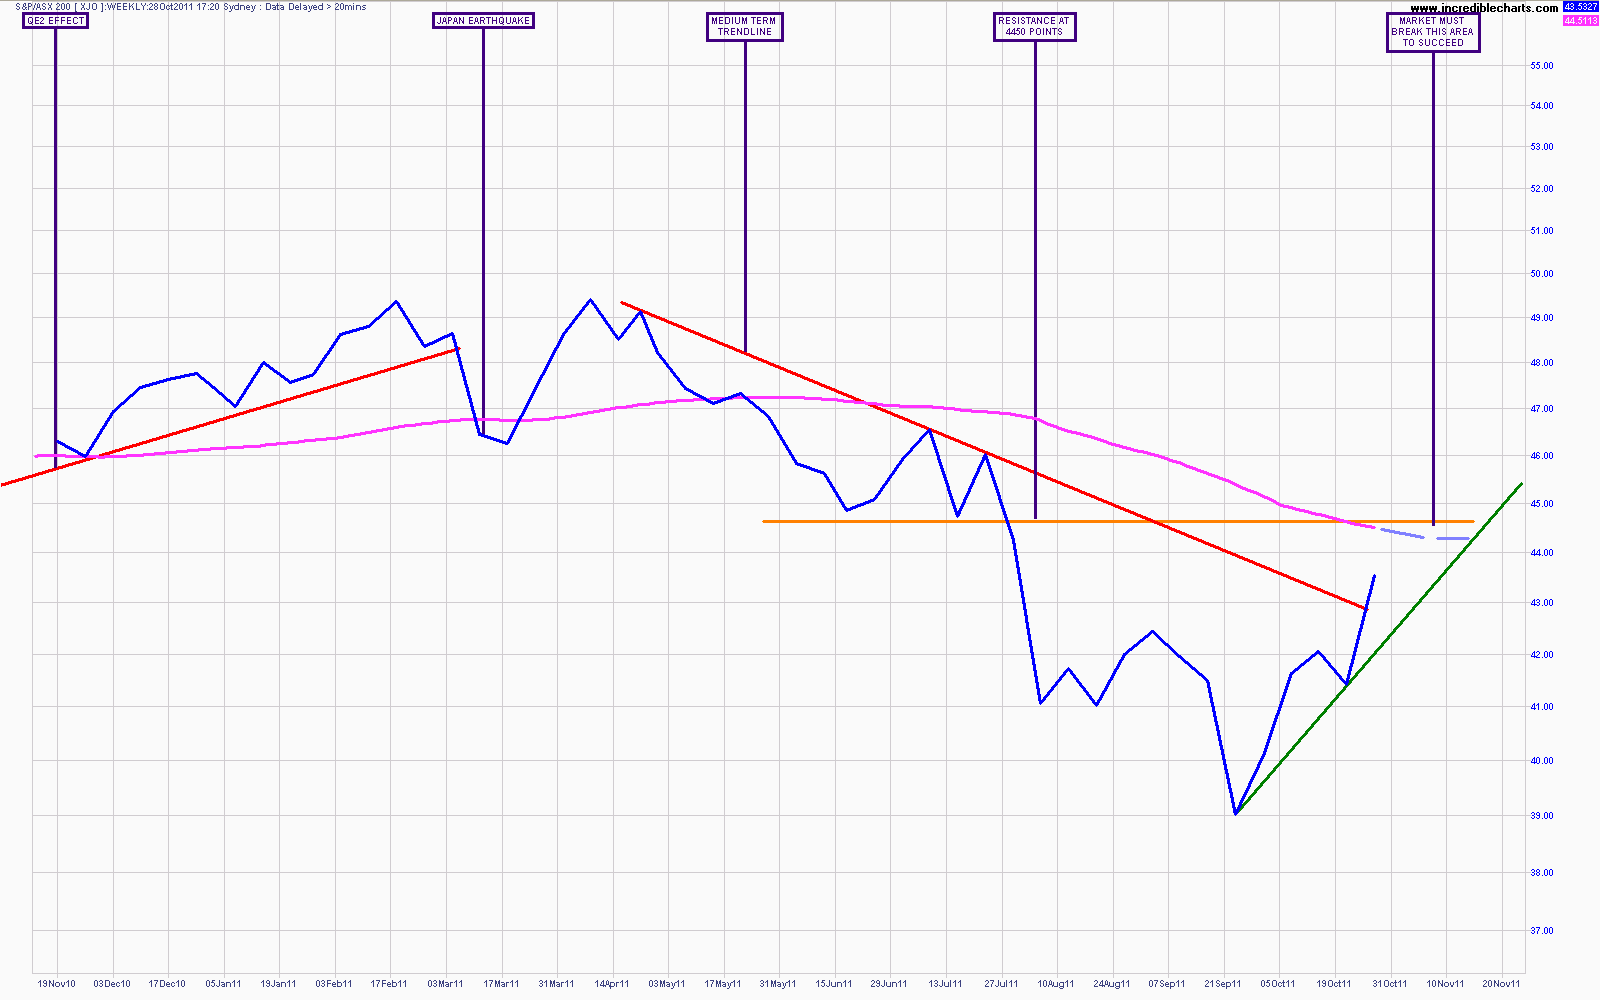
Looking at the weekly chart: (sorry about the size)
Click to enlarge
The current trend is still intact but the market has not broken through to the upside congestion area above 4450 points on a weekly basis.
Hedged medium to longer term “long” equity investors should still be “NOT LONG” in this environment.
Watch my “Chart of the Day” posts for continued analysis of US, Euro and Asian markets which will lead the way.