
The S&P/ASX 200 Index closed 105 points or 2.4% higher to 4348 points after eventually opening from the bedlam at the open and absorbing the news of a “hellish” deal involving a 50% haircut on Greek bonds to European banks. In after hours trading, the index has climbed a further 20 points, with Euro and US markets all pointing to stronger, higher opens.
Asian markets (they must have better computers) actually opened on time and traded today, with Japan’s Nikkei 225 up 1.8% at 8904 points, the Hang Seng up over 2% to 19498. The Shanghai Composite stood out for being only slightly bid up 0.3% to 2435 points.
In other risk assets, the AUD has jumped, currently trading at 105.4 cents USD, whilst WTI crude rose over 2% percent to $92.18 USD a barrel.
Gold has been steady during the Asian session building with no reaction to the EFSF bailout/haircut, and is currently at $1724 USD an ounce or $1635 AUD an ounce.
Movers and Shakers
Everything seemingly was bid up today – with the usual suspects – energy, financials and materials sectors the biggest winners.
The banks were all bid up strongly, with ANZ up nearly 2%, Commonwealth (CBA) 1.8%, National Australia Bank (NAB) up nearly 4% on an excellent result and Westpac (WBC) up 2%. Macquarie (MQG) jumped ahead over 5% to round out an excellent day for the sector which has rebounded in recent weeks, leading the overall index.
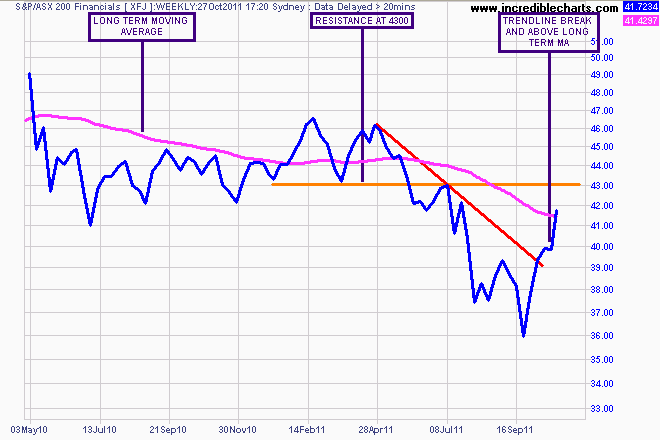
Not far to resistance at 4300
Cochlear (COH) jumped 2%, whilst its “twin” CSL gained only 0.4%. Telstra (TLS) also was a bit sluggish, only putting on 0.3% in a holding pattern.
BHP Billiton (BHP) jumped out of the gates and rose nearly 4% whilst Rio Tinto (RIO) went further at 4.4%, Newcrest Mining (NCM) up 1.6% even though gold was steady, Fortescue (FMG) up nearly 9% and Woodside Petroleum (WPL) up nearly 3%. The ASX8 are doing well….
Woolworths (WOW) was the only big name stock sold off, down 0.3% after announcing that first quarter sales figures were up almost 5%.
The Charts
What drives markets in the early stages of a rally? Fear, not greed. Greed comes later when the winnings look easy – the fear comes first (or second after canniness and fearless risk takers step in when all others run for cover).
So today was either the heralding of a new bull market in stocks, or more likely the confirmation of a bear market rally – which could go as high as 5000 points – or, more ominously, a trap. Lots of bells to listen to there – which is in tune, and what noise should you filter?
Let’s look at the daily chart first:
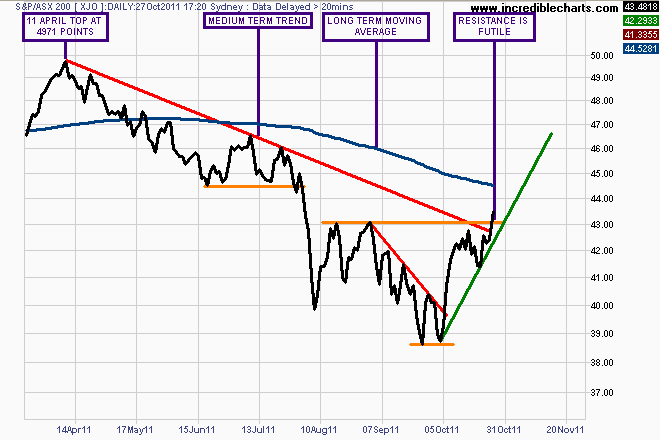
I think it’s fairly obvious where we are now. The daily downtrend from the 11 April top at 4971 points through the retest in July, before capitulation to the lows of late September and early October has been broken.
Further, the resistance level at 4300 points, which was feinted twice in August has also been broken. I expect this to be tested, with a retracement toward the trendline (marked in green) over the days ahead as the market approaches the long term moving average and the next level of resistance at 4450 points..
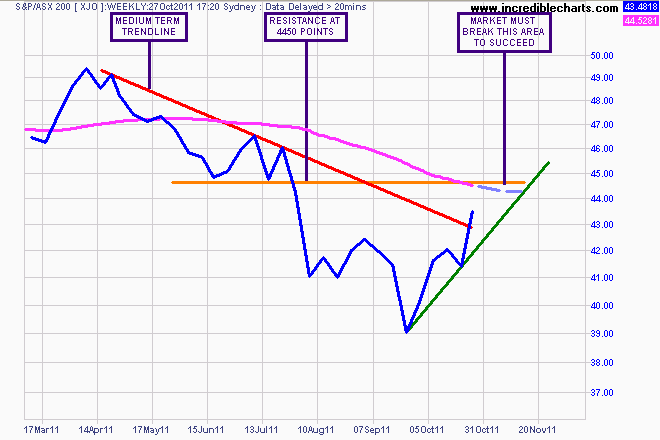
This is seen more clearly on the weekly chart above, where an inverse head and shoulders pattern has been completed successfully. The current move must be sustained above the 4450-4500 congestion area to succeed (and on a weekly, not intraday or daily close basis) with the next target of 5000 points.
Watch my “Chart of the Day” posts for continued analysis of US, Euro and Asian markets which will lead the way.