
Today’s chart comes from EconomPic created from the data and analysis within a recent Michael Pettis newsletter exploring the composition of Chinese GDP, whilst looking at if lower (or negative) interest rates cause higher savings.
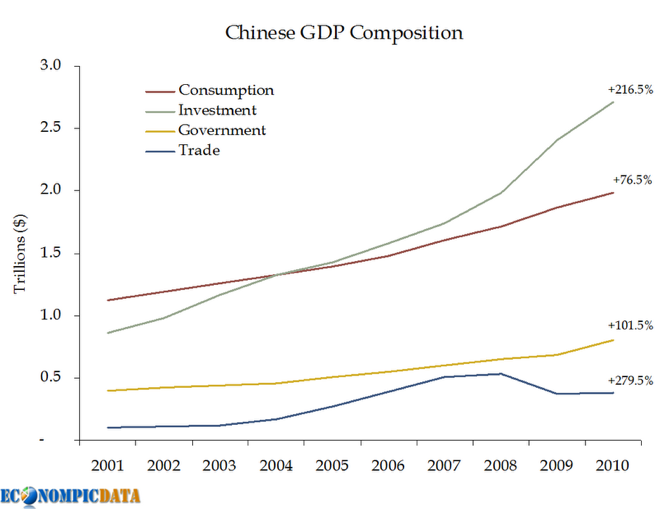
From 2001 to 2010, consumption has fallen from 45.3% to 33.8% whilst investment has increased from 34.6% of GDP to 46.2%. Government spending has been relatively stable, whilst trade has increased from just 4% to over 6% (hitting a high of 11% in 2007).
Is the growing investment composition and falling consumption a sustainable growth model? The world economy seems to hinge on this proposition…
Advertisement