
The Australian Financial Review had its annual “Power Issue” a couple of weeks ago. It’s the usual who’s who in wielding both overt and covert power. But, as we all know, power doesn’t just reside in individuals. There are external factors or influences beyond even the most powerful person’s grasp.
The Arab Spring and the nascent “Occupy Wall Street” protests are a couple of examples. As is the internet’s ability to subvert institutionalised power structure. So the AFR compiled a Power List for the inanimate as well. The internet came in first. Number 3 was climate change, number 4 was China and number 5 was the cost of living.
What came in at number 2? The most important transfer price in our economy, something near and dear to my heart – the Australian dollar! And there’s no doubt about. The dollar has the power to, and is, reshaping our economy away from industries like like tourism, education and manufacturing and towards mining.
But it wasn’t always this way. Indeed, even until relatively recently, the dollar was caught in a long term decline:
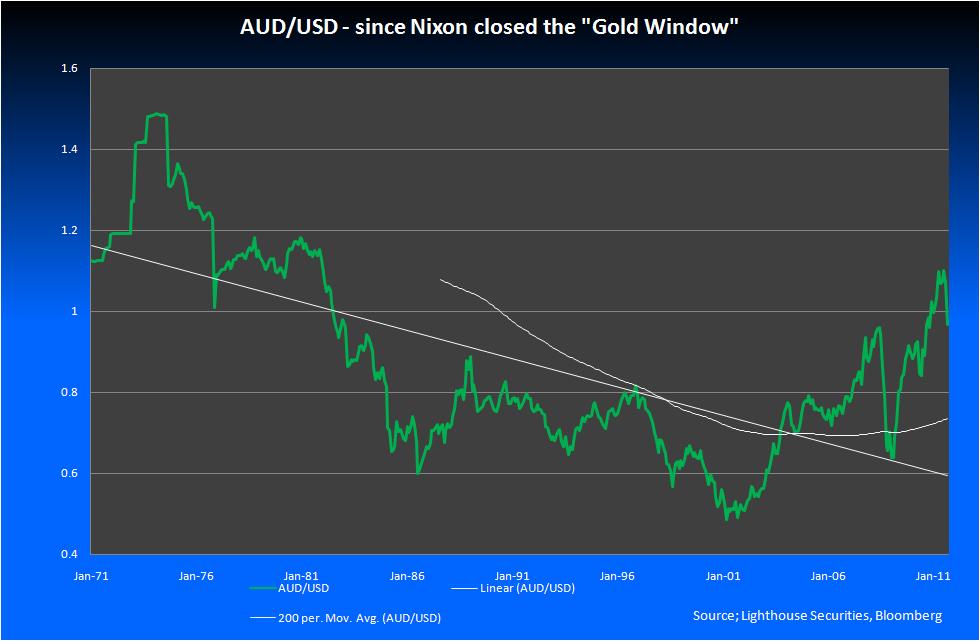
The chart above is the monthly close of the Australian dollar since Nixon closed the Gold Window in 1971. For most of this post-Bretton Woods period, corporations, traders and investors have been trained to question the credibility and durability of any and all Australian dollar rallies.
Exporters were more sanguine than importers, shorters felt it was only a matter of time before they were vindicated and longs were always nervous. The Aussie always managed to snatch defeat from the jaws of victory – that is if you see a rise as inherently better than a fall. But whatever your outlook, for years and years Australian rallies were limited and the currency kept failing.
A couple of things about this former trend are commonly misunderstood by currency market participants. The first is that the seventies and before were a very different world in which the tail end of post-war reconstruction and globalising consumerism valued material ‘stuff’ very highly. Thus Australian commodities were in demand and the dollar sat at a very high level, even if controlled.
Well before the float in the eighties, this paradigm had begun to shift towards the accelerated credit-creation of private sector banks as services became the centre-piece of global growth. Post float and into the nineties, this services and credit model culminated in the celebration of the internet, the very antithesis of “stuff”.
In this environment, the Australian dollar was a structural turkey, fluctuating but ultimately driven down to an all-time low in April 2001 around the 0.4775 level, “the half buck, buck” as it were. You can also see in the chart above the linear downtrend since 1971 and the 200 week moving average, both of which are well below the current price.
So its easy to see why many people are still trading, waiting and hoping for the Australian dollar to fall.
But times have changed. As the chart shows, the great downtrend is broken. The Reserve Bank of Australia agrees with the AFR, that this as a structural shift. After the September RBA Board meeting the minutes said:
Members noted that the high exchange rate was having a material effect on the competitiveness of a number of industries, particularly manufacturing, tourism and education. The Bank’s liaison suggested that a growing realisation that the exchange rate was likely to remain at a relatively high level was contributing to a re-evaluation of business strategies. In some cases this was leading to restructuring and even closure of facilities. However, in others it was prompting investment in new capital equipment to remain competitive, consistent with a pick-up in investment intentions in the manufacturing sector reported in the ABS capital expenditure survey.
In noting this, the RBA telling us that we just need to get used to a much stronger dollar, that industry will have to adapt. The future is going to be very different to the last twenty or thirty years for Australia and our industry.
The RBA also said that:
Historically, it has been possible to explain broad movements in the Australian dollar exchange rate by considering two important economic fundamentals, namely the terms of trade (which typically move in line with global commodity prices) and the differential between domestic and foreign interest rates. Strong world growth tends to put upward pressure on commodity prices and the terms of trade; this strengthens the outlook for returns on Australian dollar assets and increases the demand for Australian dollars from exporters, which is usually reflected in an appreciation of the exchange rate. Similarly, all else equal, strength in the domestic economy relative to the rest of the world tends to be associated with a larger interest rate differential, which also acts to appreciate the exchange rate.
Looking at the Terms of Trade since 1959 we can see the context of the current rise and why it might be impacting on the Australian dollar so materially.
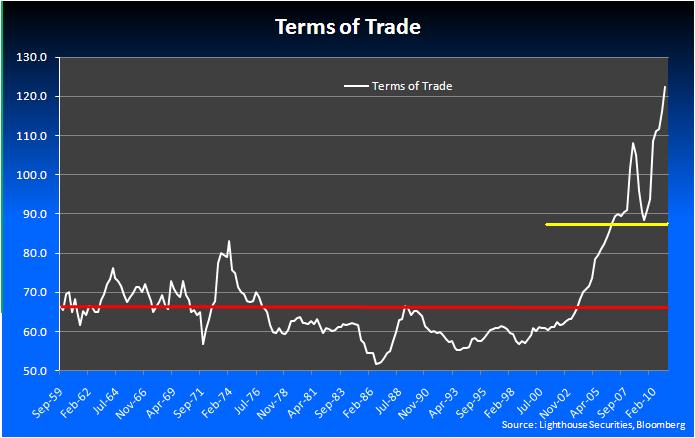
The red line is the average since 1959 of 67.58, the average since 1971 when Nixon closed the gold window is roughly similar at 67.3. The yellow line is the average of Australia’s terms of trade since China joined the WTO in 2001.
The terms of trade clearly illustrate a material impact. The following chart shows the low of the AUD/USD exchange rate in April 2001 (pink line). It was out of step with the already improving terms of trade – we were still seen as an “old” economy and our reliance on selling “stuff” was not yet recognised as the key to the new era – but the correlation is there:
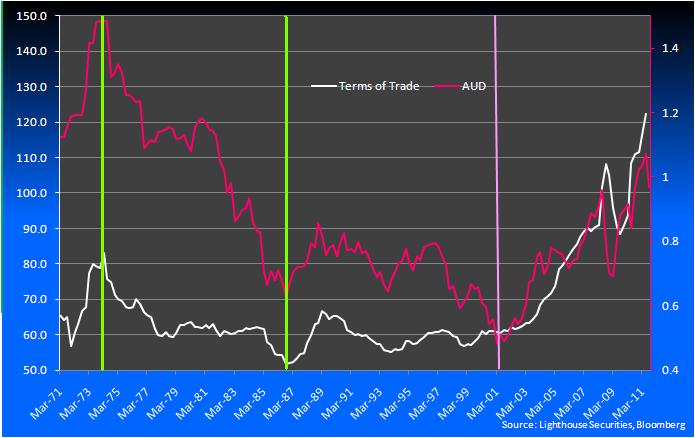
The scale on these two series distorts the linkage a little but you can see the high in the mid-1970’s and low in the 1986-87 period (greeen lines) for both the AUD/USD and the terms of trade tie up quite nicely, as do many of the other cycles and moves that pre-date the 2001 low, when investors just fell out of love with the Australian dollar.
Global growth and the terms of trade are obviously important but as the RBA points out above interest rate differentials are also important. That is certainly the case in a world of money manager capitalism where the interest rate differentials are an excuse to take currency exposure. Not only does the pick up between Australia and other nations give an incentive to buy Australian dollars, it gives an excuse to take currency risk in your portfolio for a sizable pick up if you get the trade right. But does the linkage stack up?
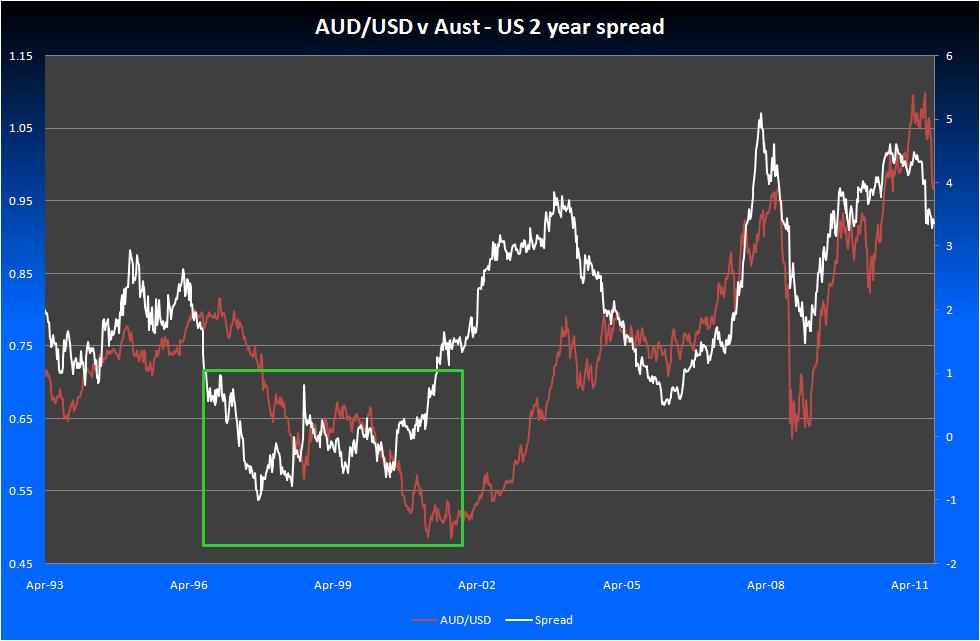
It’s not a perfect correlation, naturally, as there are many drivers of the Australian dollar, but you get a sense of how important the differential is (in this case I have used the Australian 2 year yield minus the US 2 year yield) from this chart. The box represents the period between the mid-late 1990’s and the very early 2000’s when the differential was below 1%, indeed negative for a period, when the differential gave no support to the Australian dollar. Add in a bit of terms of trade weakness, the lack of interest in “stuff” and you have the legs kicked out from the Australian dollar based on the RBA’s simple model above.
But as I have argued before, there is more to valuing the Australian dollar than the terms of trade and interest rate differentials.
Indeed, my fair valuation model has five key drivers. The RBA has covered the above 2 the other three are:
- The USD – the other side of the coin
- Global risk appetite/aversion
- Techincals
There is no denying the importance of the USD to the global currency market. The BIS’ last triennial FX survey conducted in April 2010 had the $US at an 84.9% of average daily FX turnover. The Australian dollar on the other hand was a still impressive 7.6%, coming in in 5th place overall. But the AUD/USD is the forth most traded currency pair according to the BIS.
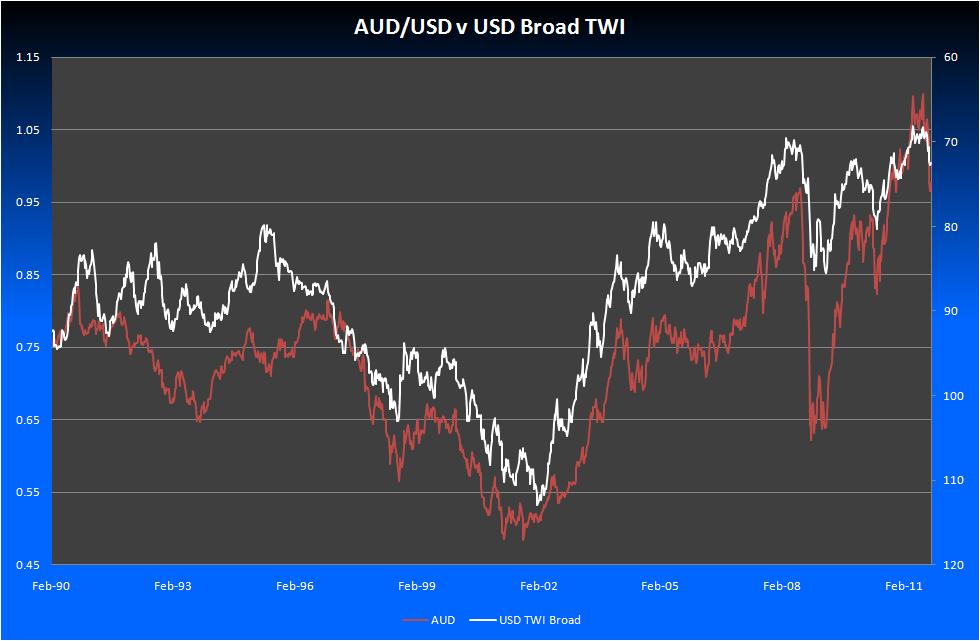
As you can see in the chart above , a large part of getting the Aussie right is about getting the $US right. Here we are looking at AUD/USD versus the Broad US TWI since 1990 – I have inverted the USD TWI to show the moves a little better. The USD has been in a secular downtrend since 2002, helping the Aussie rally. Whether this period of $US weakness has run its course is open to debate.
Abstract the big GFC selloff, and you can see a clear trend in the 3 key drivers discussed already. Strong terms of trade, high interest rate differentials and a weaker USD. All positives pushing the Australian dollar higher.
But if the history of the Australian dollar’s big falls over the post-float era – the big fall in 2008 and the smaller but material move over the past couple of months – tell us anything, it is that the Australian dollar still fits a place in many traders and investors portfolios as an off index bet. So risk appetite and investor sentiment remain important.
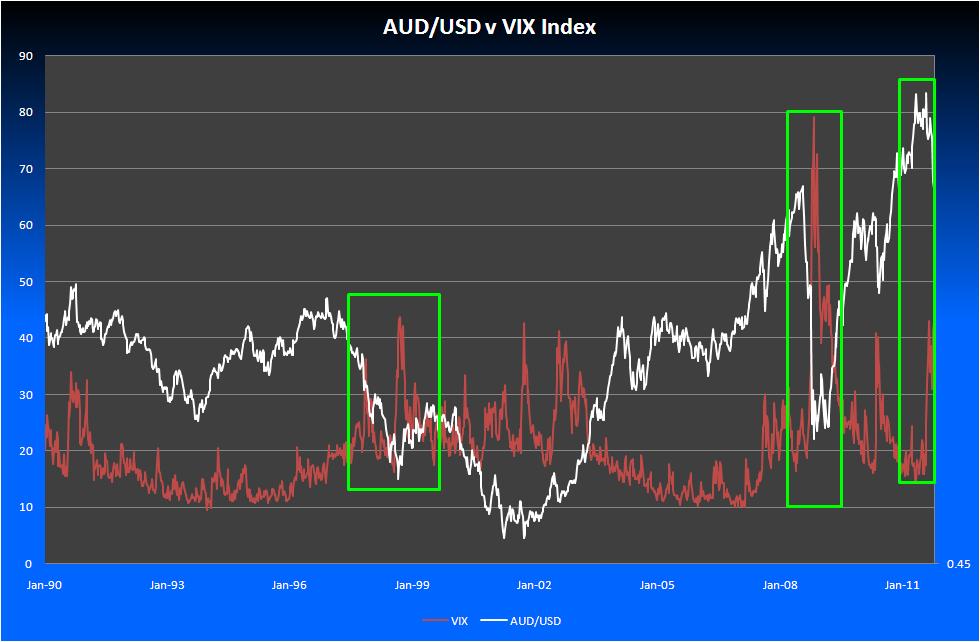
Risk aversion, risk appetite, investor sentiment – what ever you might call it – is more an on/off switch rather than a constant driver. The chart above is of the AUD/USD and the Chicago Board Options Exchange volatility Index, the VIX. This is not a perfect correlation by any stretch of the imagination. Most FX strategists who focus on the Australian dollar will have built some sort of proprietory indicator of risk that takes in a broader array of inputs than a simple equity volatility index. But for illustrative purposes you can see in the green boxes that a spike in equity volatility can often be synchronous with a big dip in the price of the AUD/USD exchange rate, and usually reflects some sort of market tension or increase in risk aversion.
This is important in the context of both the short and medium term expectation of the Australian dollar because if the economic and market volatility related with the GFC is set to continue then periods of high investor stress and thus periods of acute Australian dollar weakness are likely to be recurring.
How volatile is is the Australian Dollar likely to be? As you can see from the various charts above the AUD/USD is a volatile beast. While we might have to get used to a currency that is structurally stronger, we can’t ignore the fact that the Australian dollar is going to continue to trade through a wide range.
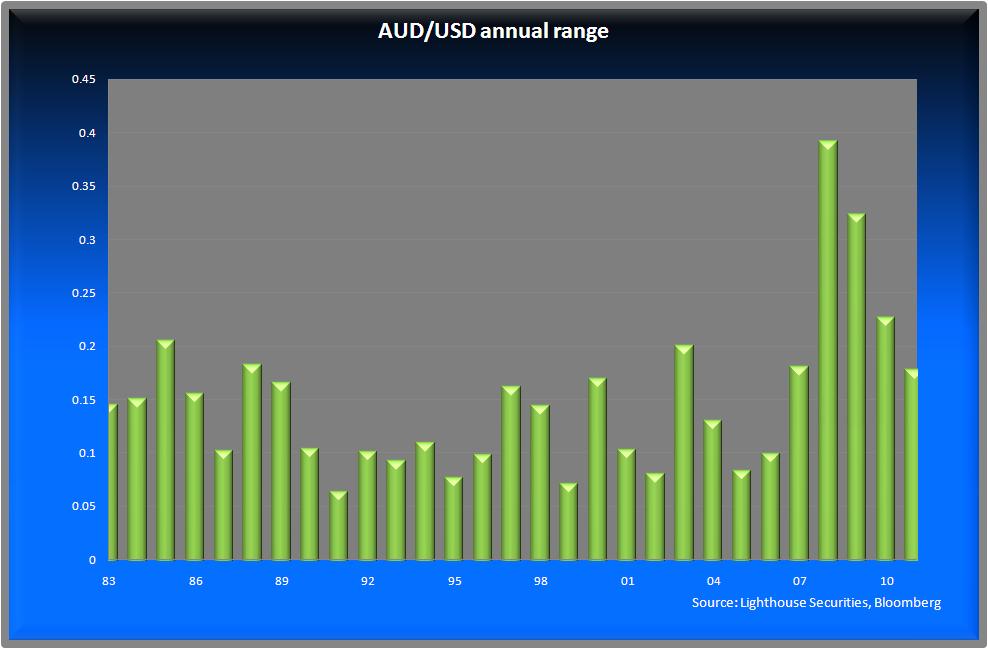
As the chart above shows the Aussie has had a material step up in volatility as measured by the annual range over the past few years since the GFC kicked off. Is this the new norm or will it revert to its post float, pre GFC, historical 12 cent range? My sense is that once the GFC has passed it will revert to type. But how long that will take is open to conjecture. So volatility looks here to stay.
The last of our five drivers for valuing the Australian dollar is “technicals”, particularly for the more trading orientated players on FX markets. I always have them in my toolkit. I will leave the technicals for another time given the fundamental nature of this piece but suffice to say that AUD is in a very broader upswing from the lows in 2001 at 0.4775:
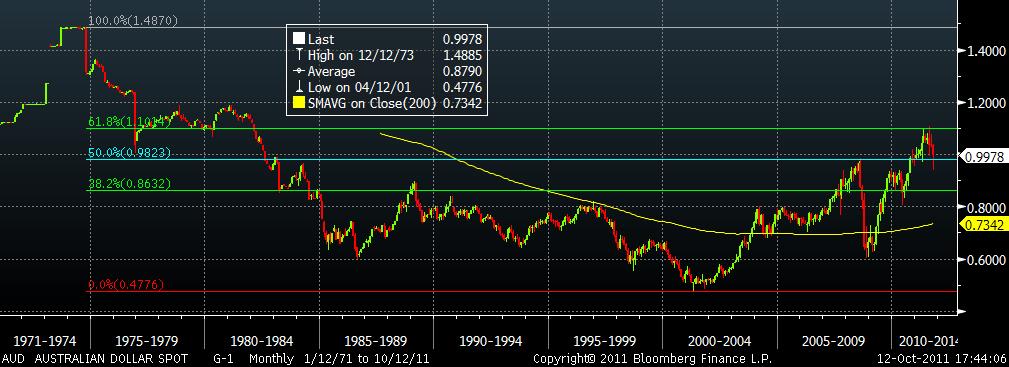
More broadly in the first decade of this century the Australian Dollar traded a range of 0.4775 in 2001 to around 1.02 at the end of 2010. Give or take a few points that is a 55 cent range!
So, where is the range likely to be in the future and what is the outlook?
I discount recent talk of the Australian dollar being a safe “haven”. The recent self off being a case in point. Real safe havens like the $US, Swiss franc and Japanese yen performed very differently to the Australian dollar’s fall. But the idea that the Australian dollar has been re-rated must have some legs given it didn’t fall as far as many expected in the fractious global markets we have been experiencing.
But this rerating could prove ephemeral because it is so closely tied to the current domestic and global settings having at its roots the record terms of trade for Australia, big interest rate differentials and a recently weak but stabilising $US.
Having said that, if the RBA is right and the strength of the terms of trade persists, it paints a picture of a world where the Australian economy is probably performing well, will maintain a fairly large interest rate differential, and will continue to attract buying from longer term buyers and mining hedgers. So the floor on the AUD/USD should be rising – indeed that appears to be the case.
In the medium term it looks to me like we might have get used to a much higher exchange rate on average – volatile as always but higher. The long run average since the float in 1983 if I use quarterly rests is 0.7425. If we go back to 1971, which might be a more relevant comparison, we see the average increases to 0.8783 with a high of 1.4850 at the end of the 2nd and 3rd quarters 1974.
Is our past our future? It just might be.