
The S&P/ASX 200 Index closed up 0.8% or 34 points today to 4072. In after hours trading, the market is up another 15 points whilst Euro and US futures point to gains.
Asian markets experienced similar moves, with the Nikkei 225 up nearly one percent to 8616 points, whilst the Hang Seng is closed for a public holiday.
In other risk assets, the AUD was steady at just above 1.03, whilst WTI crude gained 1% to $89.06 USD per barrel.
Gold was bid up slightly during the Asian session after bouncing off a low just above $1800, and is firming up coming into the London session, now at $1830 USD an ounce.
Movers and Shakers
A mixed but mainly green day across the board on the ASX, with all sectors bid up, energy stocks leading the way whilst the financials put on measly gains.
The banks were all bid up half a percent or so although CBA fell at the close, down 0.75% and Macquarie (MQG) barely moved.
BHP Billiton (BHP) provided most of the index gains (as always – may as well be called the “S&P BHP Index”), up 2.3%, whilst RIO was more modest, up 1%
Cochlear (COH) was bid up on the open and finished up 4.5% for the day to just over $60, still well off its recent heights before the product recall. (Disclosure: I was one of the bidders, as was Empire Investing)
The Charts
The weekly chart below shows the failure of the trendline from the March 2009 start of the bear market rally (which finished in May last year):
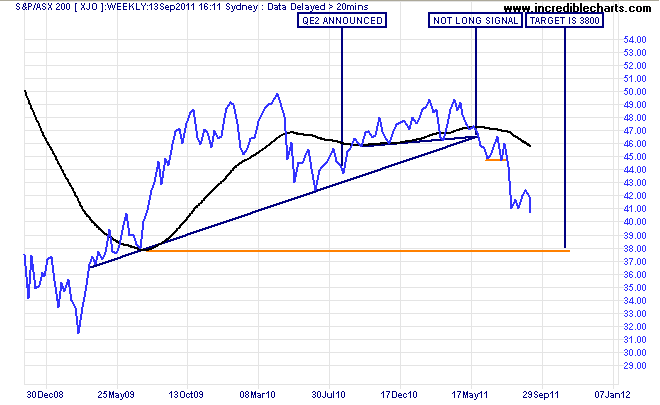
There are two orange lines to take note of – the small higher level at around 4500 points, or approx. 10% away from current levels, and the longer dated lower line at 3800 points about 7-8% away. The former is resistance, that is, a price level that MUST be exceeded for any rebound rally to be successful in turning around the dominant medium term trend since May of this year.
The latter is “terminal” support, an area tested by many other equity indices in the last couple of months. Here are some examples:
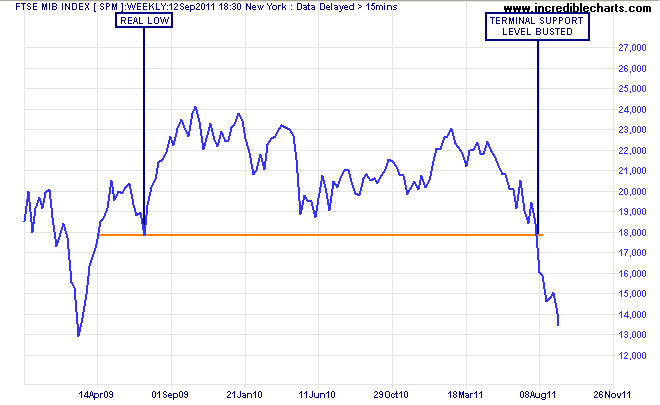
FTSE MIB Italian Index
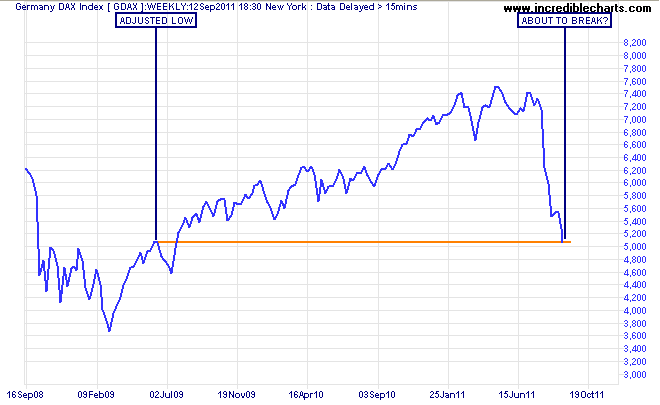
German DAX Index
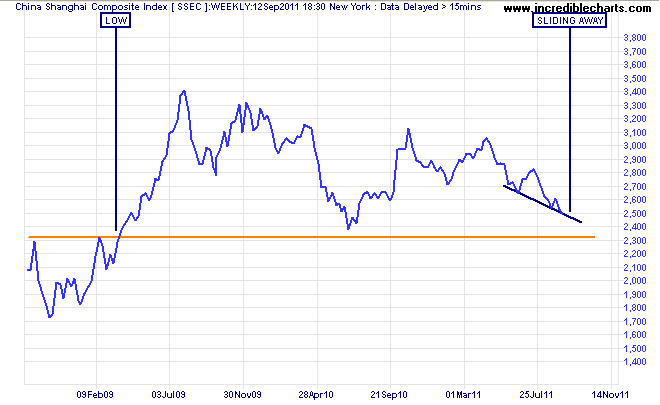
Shanghai Composite
Chartists will note that these adjusted low levels are the necklines of the inverse head and shoulder patterns, which appeared on all equity index charts in March/April 2009 (although Italy is now on its way to the oversold “head” area).
Bullish investors may want to keep these levels in mind and the fact that all current chart patterns are continuation patterns, and not be fooled by a one-day rally.