
Today’s chart starts with Colin Twigg’s trading diary, analysing the technical breakdown of copper:
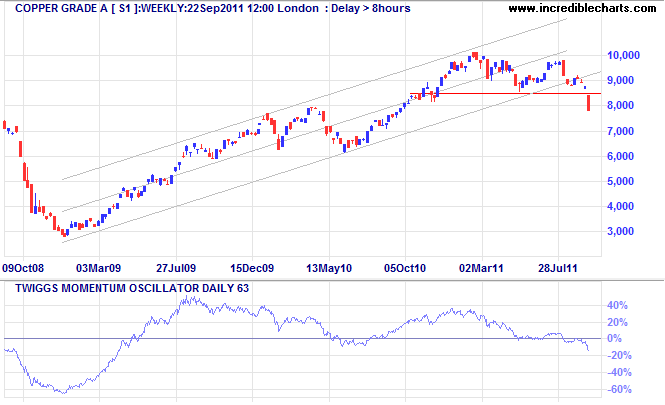
Colin Twiggs daily chart with momentum indicator below
Colin estimates a target of 7000, which puts the base metal at or slightly above its pre-QE2 price, taking the “froth” off the top. In the case of a Western recession, however, the price target is more likely far far below – just above 4000, the adjusted bottom of the GFC crash.
As for gold, here is my weekly chart with my original guideline for a correction to the long running trend:
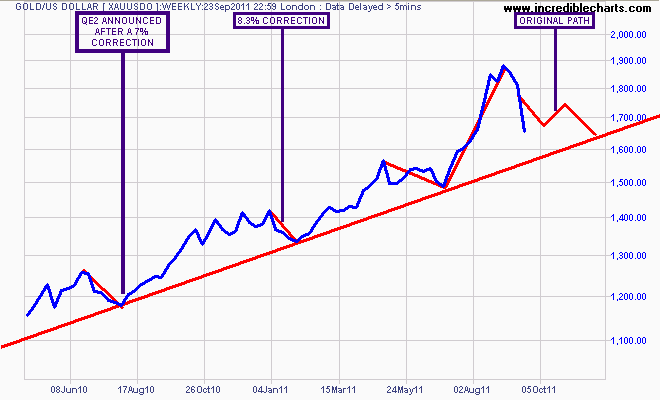
Original chart showing possibly correction path. Gold is behaving more like silver...
Note how I’ve underestimated the power of meta-money to get the hell out of dodge, with gold correcting swiftly below $1700 USD an ounce and on track to possibly break the trendline. As shown by the daily chart below, the next support range is $1450-1550 USD an ounce which corresponds with support using the long term moving average (blue line).
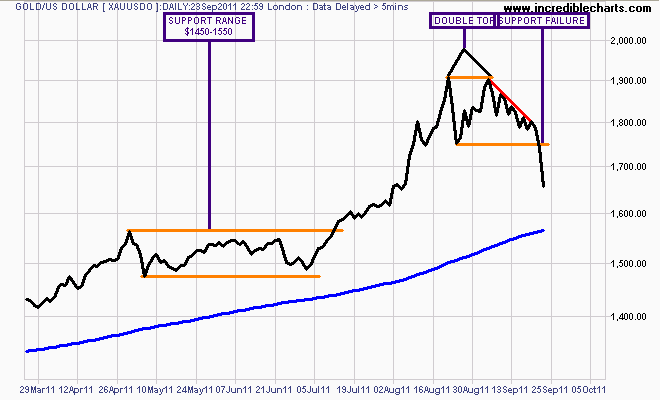
Daily chart showing breakdown and possible targets
Remember, gold corrected 28% during 2008 and took 18 months (and the application of QE 1.5) to regain its previous high at $1000 USD an ounce. A similar correction, alongside other metals and commodities as meta-money seeks shelter and a recession is fully priced in, sans further stimulus, could take gold down to $1375 USD an ounce.
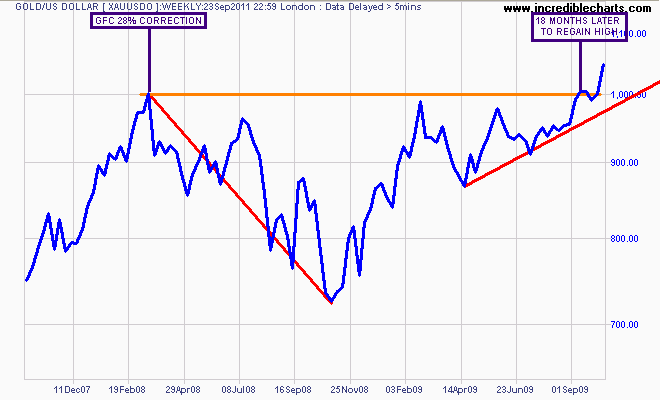
Gold crumbled during the GFC, abrogating its "crisis" status.
Aussie, Aussie, Aussie?
As for gold holders in Aussie dollars (AUD), the long term chart shows quite a different pattern. First, in AUD terms, gold corrected approx. 15% druing the GFC, before bubbling almost 50% thereafter as gold went up and AUD went down. Following this was a significant 23% correction mainly due to the AUD appreciating against USD, even though gold in USD was rising. Eventually AUD gold formed an ascending triangle, surpassing the post-GFC bubble high in mid-July and broke out alongside other currencies denominated in gold.
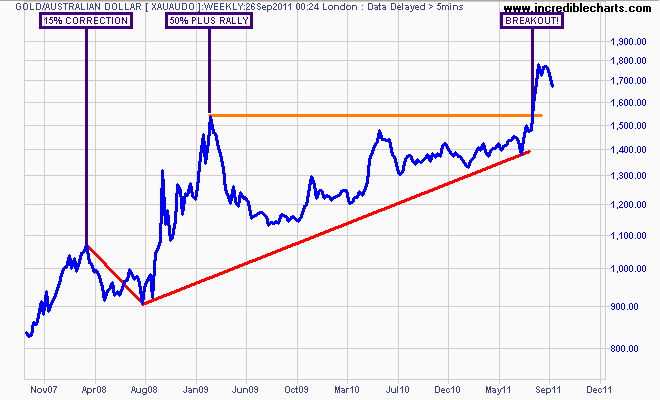
Weekly chart of gold in AUD - correction during GFC was smaller than USD
The short term pattern is very bearish – a symmetrical triangle with a breakout below. It is most likely, even as the AUD itself falls, that gold priced in AUD will follow down to pre-blowoff levels, approx. $1380 to $1460 AUD an ounce.
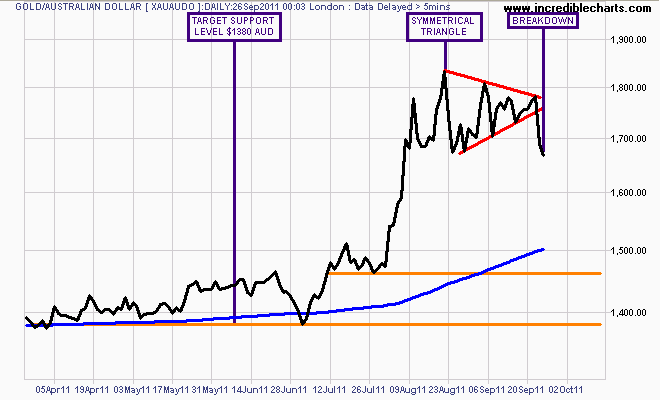
Daily chart of gold in AUD